Top JavaScript Monitoring Tools: RUM, Error Tracking & Debugging
Advertisement
Top JavaScript Monitoring Tools: RUM, Error Tracking & Debugging
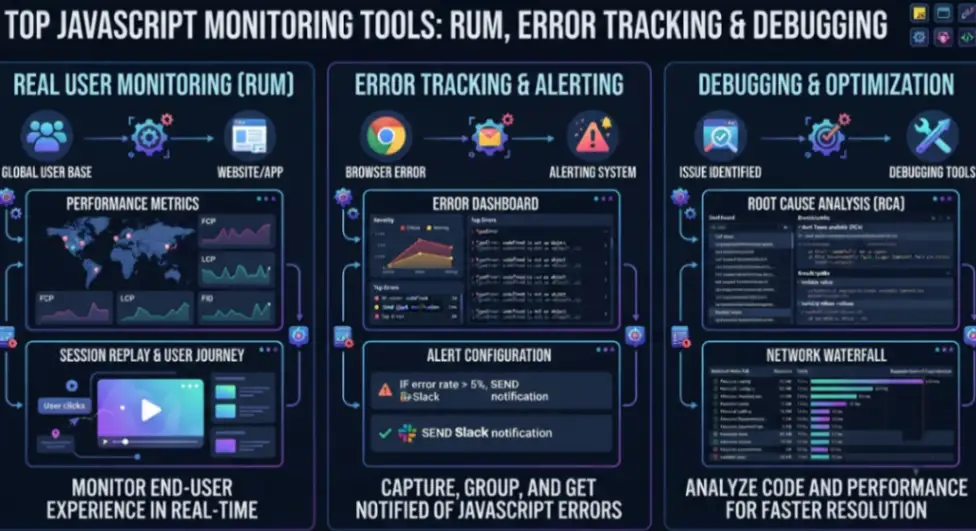
Ensuring cross-browser compatibility and front-end performance requires strict adherence to web standards established by the W3C. Implementing continuous browser performance tracking, automated error aggregation, and telemetry collection guarantees optimal user experiences while reducing mean time to resolution (MTTR) across complex JavaScript stacks.
1. Aikido
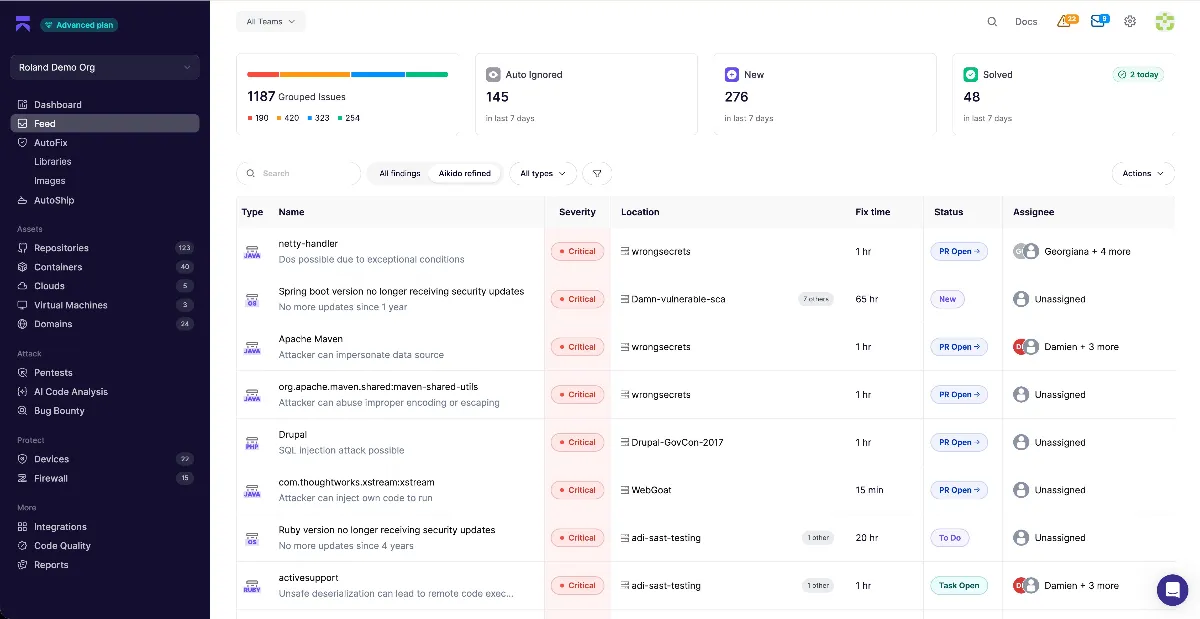
Aikido provides a unified security and code quality monitoring platform for JavaScript applications, scanning source code, open-source dependencies, and web APIs within a single dashboard. It continuously analyzes frontend and backend JavaScript ecosystems for runtime vulnerabilities and structural code defects.
- Unified Code & SAST Scanner: Runs static analysis directly against JavaScript codebases to detect vulnerabilities, exposed API secrets, and unsafe dependencies.
- Automated IDE Remediation: Integrates into major IDEs and CI/CD pipelines to offer one-click automated code fixes during active development.
- Full-Stack Dependency Auditing: Scans `package.json` lockfiles in real time to identify CVEs across third-party npm packages and transitive libraries.
2. Site24x7
Site24x7 provides Real User Monitoring (RUM) and synthetic monitoring for JavaScript web applications, tracking frontend execution speeds, AJAX network latency, and Core Web Vitals. It captures browser-level telemetry to isolate regional network bottlenecks and client-side rendering bottlenecks.
- Core Web Vitals Telemetry: Automatically measures Largest Contentful Paint (LCP), Interaction to Next Paint (INP), and Cumulative Layout Shift (CLS) across real browser sessions.
- AJAX & Fetch Performance Tracking: Monitors client-side network calls, recording response latency, HTTP status codes, and failed payload transmissions.
- Geographic Session Segmentation: Correlates JavaScript execution speed and rendering times against end-user ISP, device type, browser vendor, and location.
3. Airbrake
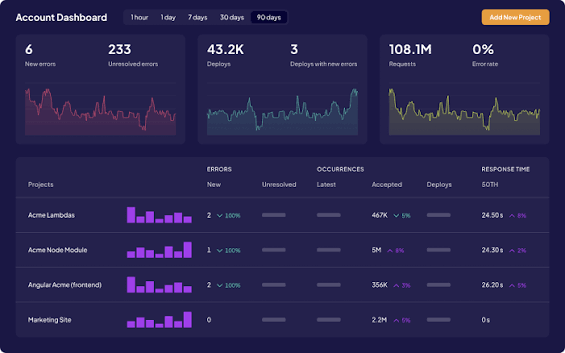
Airbrake is a real-time error monitoring and performance tracking tool built for software developers, capturing JavaScript exceptions before they impact end users. It provides detailed call stack analysis, release tracking, and deployment impact reports across single-page applications.
- Source Map De-Minification: Automatically resolves obfuscated production stack traces back to uncompiled source code lines using uploaded source maps.
- Breadcrumb Event Trail: Captures click events, network requests, console logs, and state changes leading up to a client-side JavaScript crash.
- CI/CD Deployment Tracking: Correlates error spikes directly with specific code deployments and Git commit hashes to streamline rollback decisions.
4. Sentry
Sentry is an open-source error tracking and performance monitoring platform designed to provide deep stack visibility across client-side JavaScript and Node.js applications. It correlates runtime exceptions with session replays, transactions, and distributed back-end traces.
- Automatic Exception Aggregation: Deduplicates client-side errors using stack trace fingerprinting to group identical unhandled promise rejections and runtime exceptions.
- Integrated Session Replay: Reconstructs DOM mutations, mouse trajectories, and network activity leading up to a JavaScript crash using a lightweight recorder.
- OpenTelemetry Tracing: Emits distributed trace context headers from browser `fetch` and `XHR` calls to backend Node.js, Python, or Go microservices.
5. GlitchTip
GlitchTip is an open-source, Sentry-compatible error reporting tool that collects and organizes JavaScript exception reports in a clean, accessible web dashboard. It acts as a lightweight, self-hostable monitoring backend for open-source development teams.
- Sentry SDK Native Compatibility: Ingests telemetry directly from official `@sentry/browser` and framework-specific JavaScript SDKs without custom integration code.
- Lightweight Open-Source Architecture: Built on Django and Postgres, allowing simple self-hosting via Docker without complex multi-service infrastructure.
- Issue Grouping & Alert Routing: Groups incoming crash logs by stack signature and routes real-time alert notifications to Webhooks, Slack, or email.
6. Raygun
Raygun offers Real User Monitoring (RUM) and Crash Reporting for JavaScript applications, capturing diagnostic stack traces and client-side performance metrics. It monitors single-page application (SPA) routing, asset load times, and individual user session histories.
- Detailed User Session Mapping: Traces individual user journeys across web pages, displaying every client-side error and slow network request in chronological order.
- SPA Route Transition Diagnostics: Tracks view rendering times and component lifecycle overhead across modern frameworks including React, Angular, and Vue.
- Automated Source Map Ingestion: Securely fetches or accepts source maps via API to transform minified production scripts into readable source lines.
7. Rollbar
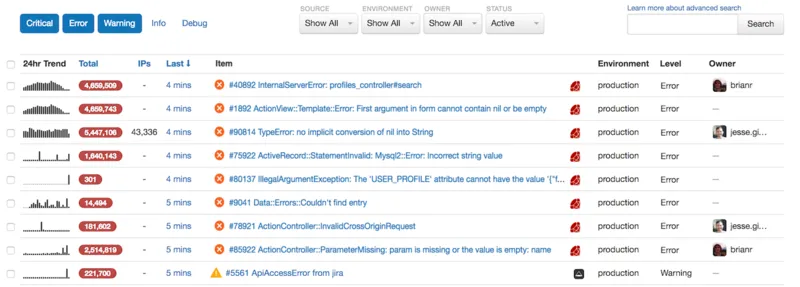
Rollbar provides real-time error aggregation and continuous deployment monitoring for JavaScript applications, utilizing machine learning to group exception streams. It provides continuous visibility into client-side code stability across web browsers and Node.js environments.
- Telemetry-Driven Error Deduplication: Employs AI-driven grouping rules to prevent log noise by merging duplicate stack traces regardless of dynamic variable values.
- Automated Feature Flag Tracking: Links client-side runtime errors to specific feature flags and A/B test variants to identify risky deployment toggles.
- Real-Time Deploy Telemetry: Tracks exception velocity following code releases, triggering automated rollback alerts if error thresholds are exceeded.
8. Komodo IDE
Komodo IDE is a comprehensive multi-language development environment featuring advanced built-in JavaScript debugging, version control integration, and static code inspection. It allows developers to set breakpoints, inspect variables, and step through client and server-side JS code.
- Integrated Node.js & Browser Debugger: Supports local and remote debugging sessions, enabling breakpoint placement and live scope evaluation within the IDE.
- VCS & DOM Introspection: Integrates directly with Git, Subversion, and Mercurial while providing real-time syntax checking and DOM property inspection.
- Cross-Platform Runtime Execution: Runs and tests JavaScript snippets across local runtime environments directly from the editor environment.
9. Visual Studio
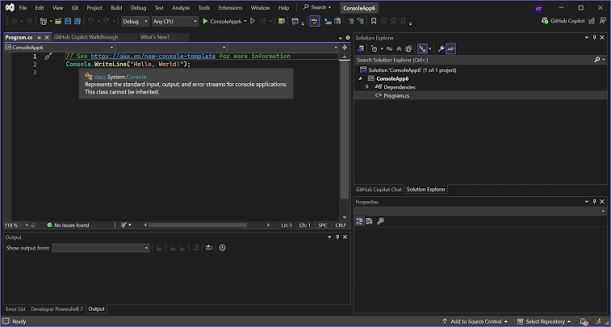
Microsoft Visual Studio is an enterprise integrated development environment offering powerful JavaScript and TypeScript debugging, memory profiling, and static code diagnostics. It integrates directly with browser developer engines to enable unified client-server debugging.
- Direct Browser Script Attachment: Attaches directly to running Microsoft Edge and Google Chrome instances to debug client-side scripts from source files.
- JavaScript Memory Profiler: Measures heap allocation, memory leaks, and object retention graphs in client-side scripts and Node.js processes.
- TypeScript First-Class Support: Provides real-time type checking, AST inspection, and inline execution state evaluation for complex TypeScript projects.
10. JS Bin
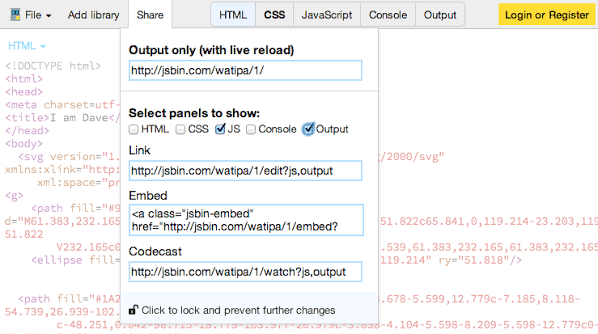
JS Bin is an online collaborative JavaScript debugging and prototyping tool designed for rapid code testing, error isolation, and snippet sharing. It renders real-time HTML, CSS, and JavaScript output alongside an interactive console and network event viewer.
- Real-Time Live Rendering Engine: Evaluates JavaScript code instantly upon keystroke, updating the DOM and logging output to an embedded virtual console.
- Collaborative Pair Debugging: Enables real-time multi-user editing sessions via synchronized URLs for collaborative troubleshooting and code reviews.
- Library Auto-Injection API: Allows instant injection of popular JavaScript libraries (e.g., React, Lodash, D3) into active debugging environments via CDN selection.
11. Airbrake (Deployment & Performance Tracker)
Airbrake’s performance monitoring engine extends its core error tracking capabilities by capturing real-user interactions, slow API calls, and asset loading bottlenecks. It allows teams to visualize frontend transaction performance alongside crash reports in a single console.
- Full-Stack Route Performance: Measures execution latency across specific SPA routes, isolating slow DOM updates from delayed backend API responses.
- Custom Event & Metric Instrumentation: Exposes a flexible JavaScript API to track business-critical actions and custom frontend performance counters.
- Real-Time Alerting Pipeline: Integrates with Airbrake workflow integrations like Webhooks, PagerDuty, and Slack for rapid incident response.
Frequently Asked Questions
How do source maps enable accurate JavaScript error tracking in production environments?
Production JavaScript is routinely minified, bundled, and obfuscated to reduce file sizes and network latency. Source maps act as mapping files that translate compiled production line and column numbers back to the original, uncompiled source code, allowing monitoring tools to present readable stack traces with accurate file names and function signatures.
What is the difference between Real User Monitoring (RUM) and synthetic JavaScript monitoring?
Real User Monitoring (RUM) captures performance metrics, errors, and navigation data from actual human users accessing your web application in real time across different browsers and locations. Synthetic monitoring uses headless browsers or automated scripts to simulate user interactions at regular intervals, providing baseline performance benchmarks and verifying application uptime independently of live user traffic.
How do browser performance tools measure Core Web Vitals in single-page applications (SPAs)?
Monitoring tools utilize standard browser Performance Observer APIs to listen for layout shifts, paint timing events, and input delays. In SPAs, these tools dynamically reset and calculate route-specific metrics during soft page navigations (client-side routing without full page reloads), accurately attributing metrics like Interaction to Next Paint (INP) to specific SPA views.
Advertisement