Modern Python Debugging Tools: Architecture & Performance Profiling
Advertisement
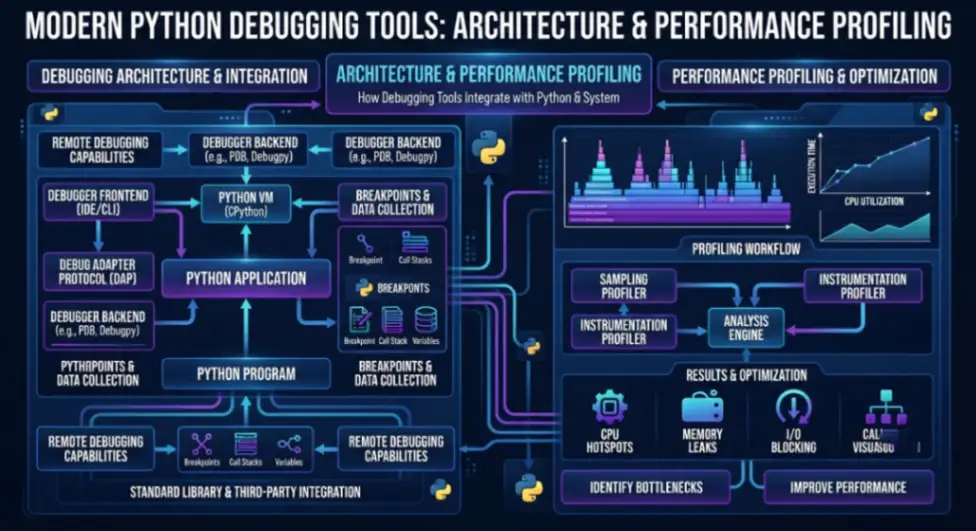
Modern Python Debugging Tools: Architecture & Performance Profiling
Developing resilient enterprise Python applications requires deep visibility into memory allocation, thread execution states, and call stack evaluation. Standard software lifecycle specifications established by IEEE emphasize rigorous runtime verification and diagnostic trace logging during continuous integration workflows. Leveraging specialized Python debuggers ensures low performance overhead while providing granular stack frame access across distributed application architectures.
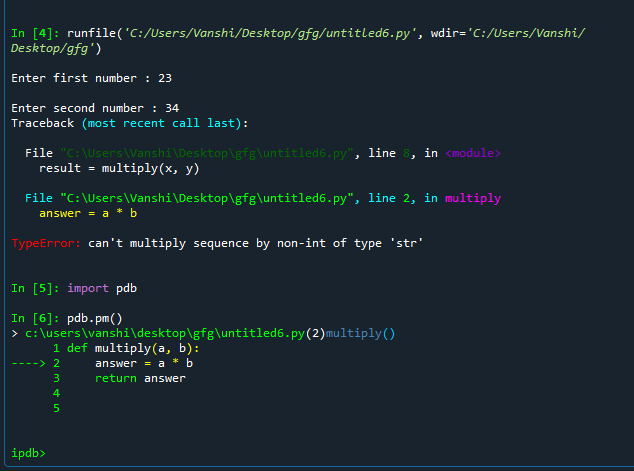
1. PDB (Python Debugger)
PDB is the standard library interactive debugger built directly into Python, relying on CPython sys.settrace hooks to inspect execution states. It enables post-mortem analysis, line-by-line stepping, and arbitrary code execution within local stack frame contexts.
- Native Runtime Integration: Zero external dependencies, utilizing native Python interpreter hooks to set execution breakpoints (`breakpoint()`) and inspect frame objects directly.
- Interactive Frame Navigation: Provides dynamic stack traversal commands (`up`, `down`, `where`) to evaluate variable scope across calling frames in real time.
- CLI Scriptability: Supports conditional breakpoints and execution aliases for automating repetitive debugging steps within headless terminal environments.
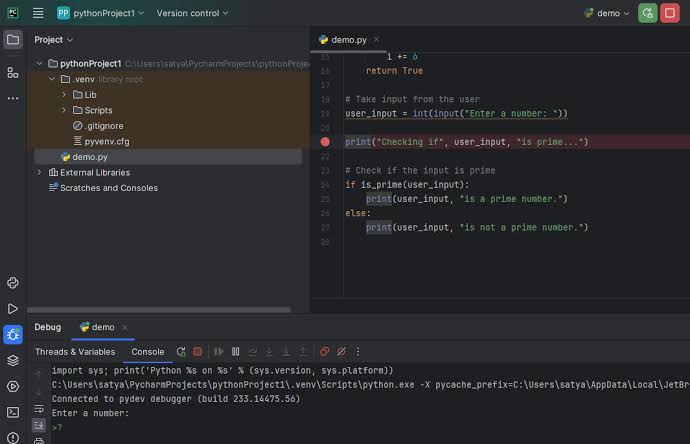
2. PyCharm Debugger
JetBrains PyCharm features a high-performance visual debugger optimized for complex multi-threaded and asynchronous Python web applications. It utilizes compiled Cython speedups to minimize tracing overhead during live execution breakpoints.
- Cython Accelerator Core: Uses native C-extension speedups to process tracing hooks, drastically reducing runtime degradation during deep stack frame monitoring.
- Remote & Container Debugging: Native integration with SSH, Docker Compose, and Kubernetes pods via remote debugging servers (`pydevd`).
- Advanced Concurrency Views: Real-time thread state inspection, Asyncio event loop visualization, and dynamic variable evaluation inline with source code.
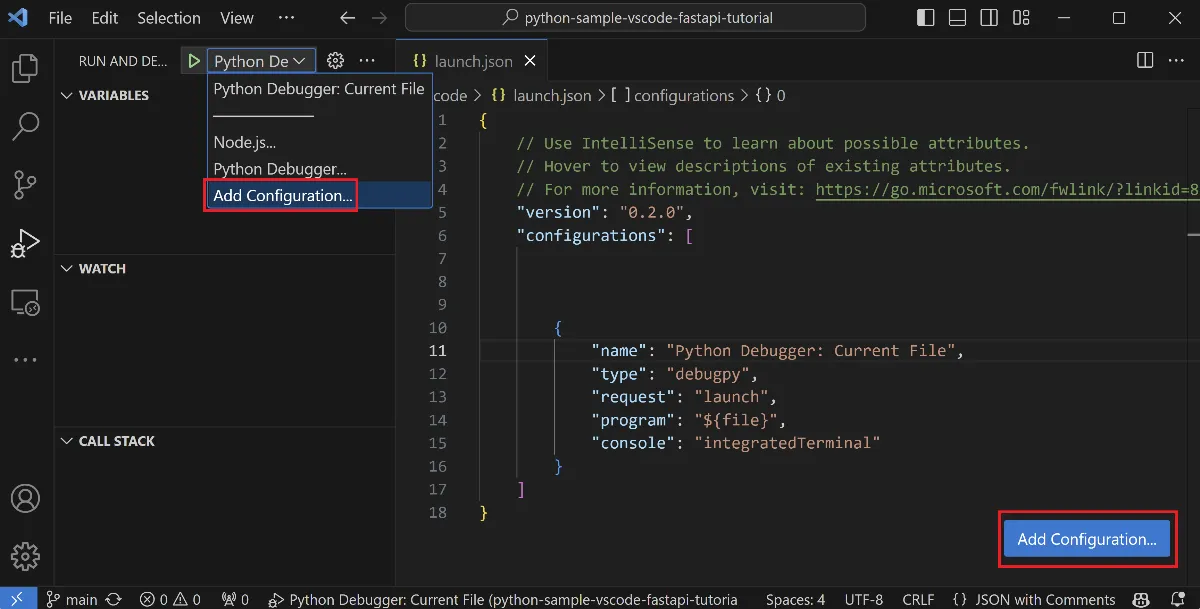
3. debugpy
debugpy is Microsoft’s implementation of the Debug Adapter Protocol (DAP) for Python, powering debugging extensions in VS Code and remote development servers. It acts as a standardized IPC transport layer between IDE frontends and the CPython target runtime.
- Debug Adapter Protocol (DAP) Native: Decouples the user interface from the underlying execution runtime using JSON-RPC messages over socket connections.
- Process Attachment API: Allows engineers to attach debuggers on-the-fly to running, un-instrumented Python processes via process ID (PID) injection.
- Multi-Threaded & Subprocess Isolation: Automatically tracks and attaches to spawned child processes and worker threads across distributed tasks.
4. IceCream (ic)
IceCream is a lightweight debugging library designed to replace standard print statements by inspecting arguments, variable names, and code execution contexts automatically. It leverages abstract syntax tree (AST) analysis to output detailed syntax-highlighted execution traces.
- AST Expression Introspection: Uses Python AST parsing to print both the variable name and its underlying runtime value automatically without manual string formatting.
- Zero-Argument Trace Logging: Invoking `ic()` without arguments automatically outputs the executing file name, line number, and parent function context.
- Global Output Control: Provides programmatic APIs to disable, redirect, or format log outputs globally across enterprise codebases.
5. Py-Spy
Py-Spy is a low-overhead, sampling profiler for Python applications written in Rust that inspects CPython process memory without modifying state or locking execution threads. It is designed to safely profile production services under live traffic conditions.
- Out-of-Process Memory Sampling: Reads process CPython stack state via OS-level memory APIs (`process_vm_readv`) without running in-process Python code.
- Production Zero-Impact Profiling: Operates completely independent of the target runtime, guaranteeing zero performance penalty or thread locking on monitored applications.
- Visualization & Flamegraph Generation: Generates real-time SVG flamegraphs and console call-tree views to isolate CPU-bound bottlenecks instantly.
6. Ipdb
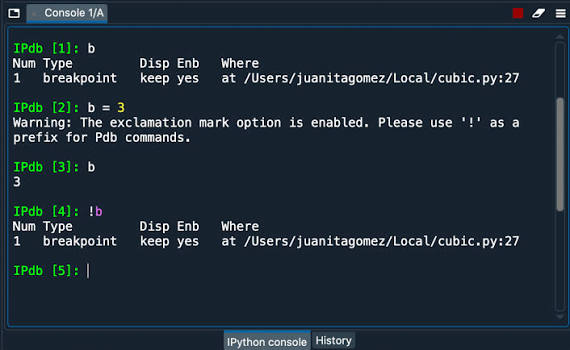
Ipdb integrates IPython's enhanced interactive shell into the standard PDB interface, adding syntax highlighting, tab completion, and advanced object introspection to CLI debugging workflows. It speeds up local root-cause analysis via rich terminal formatting.
- IPython Shell Integration: Embedded auto-completion, multi-line code execution, and dynamic object attribute inspection within breakpoint sessions.
- Colorized Traceback Displays: Highlights active syntax and frame variables cleanly to accelerate reading complex nested exception trees.
- Context-Aware Shell Commands: Access to magic commands (`%timeit`, `%who`) directly inside active debugging stack frames.
7. Pysnooper
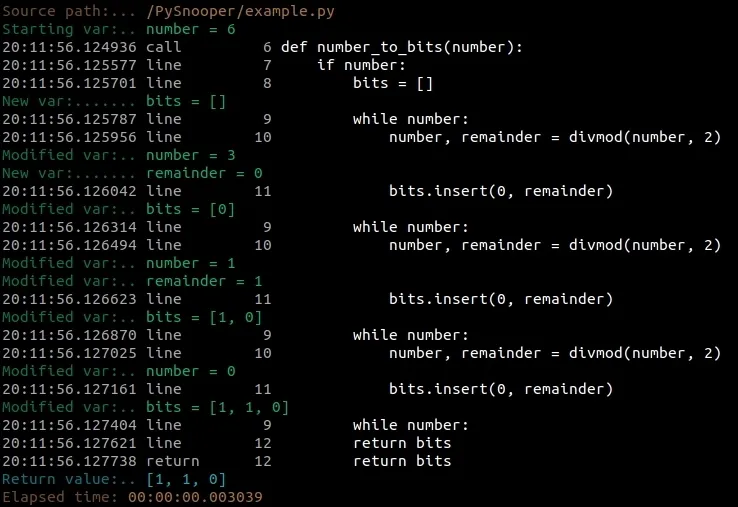
PySnooper is an automated logging debugger that records line-by-line execution details and local variable mutations without requiring interactive terminal breakpoints. It is ideal for debugging complex asynchronous functions and headless CI/CD batch pipelines.
- Decorator-Based Tracing: Simple `@pysnooper.snoop()` decorator tracks entering functions, variable modifications, and line execution sequences automatically.
- File & Stream Redirection: Supports writing comprehensive execution logs directly to external log files, standard error streams, or custom write handlers.
- Deep Property Inspection: Supports custom attribute extraction to recursively log fields inside complex data classes, dictionaries, and custom objects.
8. Memory Profiler
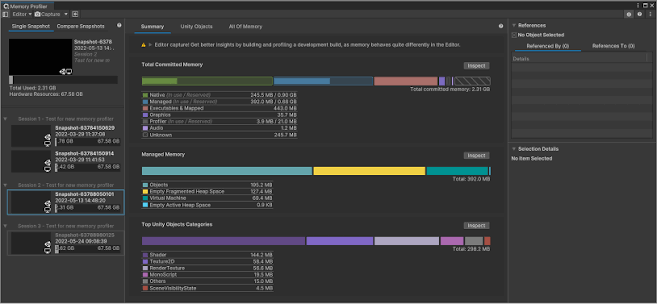
Memory Profiler is a module for monitoring line-by-line memory consumption of Python code, utilizing OS process utilities to isolate memory leaks and excessive allocation vectors. It assists engineers in optimizing memory-heavy data pipelines and ML workflows.
- Line-by-Line Memory Tracking: Measures physical memory usage (RSS) before and after each executed line using the `@profile` decorator.
- Process Subsystem Polling: Queries operating system process APIs (`psutil`) to monitor peak RAM consumption across execution lifecycles.
- Integration with Plotting Tools: Exports time-series memory usage graphs via Matplotlib to visualize memory allocation spikes under load.
Frequently Asked Questions
What is the primary architectural difference between tracing debuggers (PDB, debugpy) and sampling profilers (Py-Spy)?
Tracing debuggers inject hooks into the CPython runtime (`sys.settrace`), intercepting every line or function call to provide interactive stack evaluation, which introduces noticeable execution overhead. Sampling profilers read the memory space of target processes externally at specified intervals, delivering accurate performance profiles with virtually zero impact on live application speed.
How does the Debug Adapter Protocol (DAP) simplify IDE debugger integration?
DAP standardizes the communication protocol between development tools (like VS Code or Neovim) and debugging engines (like debugpy). Instead of building custom integration layers for every IDE and language pair, DAP provides a unified JSON-RPC interface for setting breakpoints, inspecting variables, and stepping through code execution.
Can I use Py-Spy safely in a production environment?
Yes. Py-Spy is specifically engineered for production environments because it runs outside the target CPython process using native OS memory-reading calls. It does not pause threads, modify bytecode, or execute code inside your application process, making it safe to profile live production workloads without service downtime.
Advertisement