Architectural Deep Dive into Site24x7: Enterprise Cloud Observability, Synthetic Testing, and Infrastructure Telemetry
Advertisement
Architectural Deep Dive into Site24x7: Enterprise Cloud Observability, Synthetic Testing, and Infrastructure Telemetry
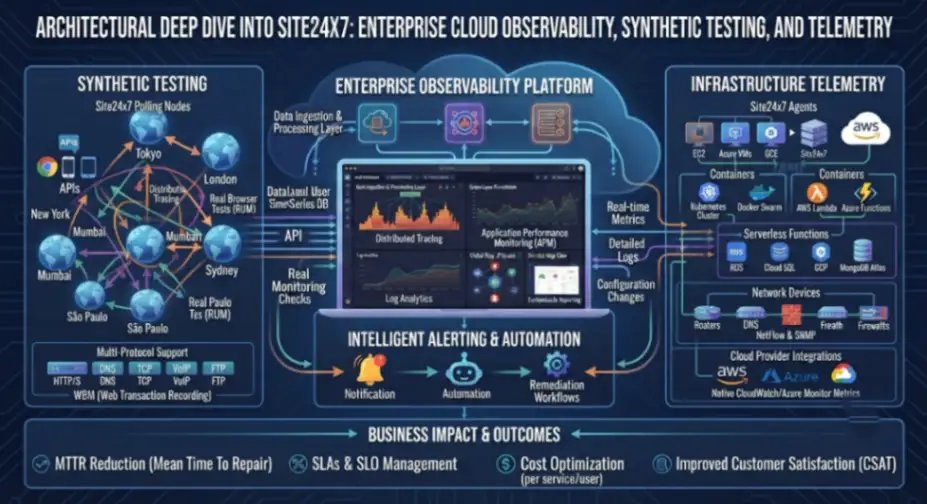
As modern cloud topologies transition from monolithic deployments to distributed Kubernetes microservices and serverless architectures, effective observability demands multi-vector telemetry ingestion. Enterprise Site24x7 deployments leverage lightweight binary daemons, OpenTelemetry extensions, and cloud-native API integrations aligned with standards defined by the Institute of Electrical and Electronics Engineers (IEEE) to establish proactive anomaly detection, continuous availability verification, and real-time operational response across global network boundaries.
1. Global Synthetic Website & API Availability Monitoring
Site24x7 executes continuous synthetic transaction checks across a distributed network of over 130 global PoPs to measure multi-step web application performance and API SLA compliance. The engine simulates real user interactions using headless browser instances and raw socket connections to validate DNS resolution, SSL/TLS handshake latency, TTFB, and HTTP payload integrity.
- APIs & Protocols: REST, SOAP, GraphQL, gRPC, WebSocket, DNS, SMTP/IMAP, and raw TCP/UDP protocol probes.
- ML & Analytics: AI-driven baseline anomaly models that dynamically recalculate latency thresholds and suppress localized network transient false positives.
- Deployment Types: Fully managed multi-tenant SaaS cloud network with options for Private Location On-Premises Monitoring Agents.
2. Server & System Infrastructure Telemetry
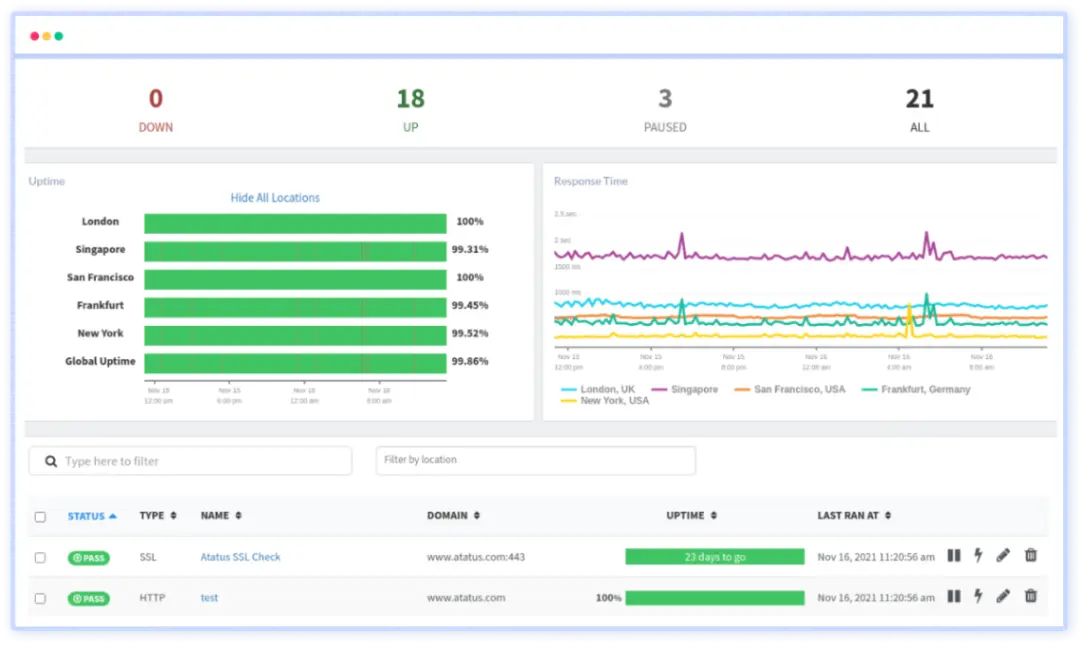
The platform tracks host-level metrics across physical, virtual, and containerized server instances via lightweight system daemons. It captures CPU user/system utilization, memory paging, disk I/O queue lengths, process trees, and network throughput at granular time intervals.
- APIs & Protocols: Native OS APIs (Windows WMI/Performance Counters, Linux procfs/eBPF), SSH, SNMP, and OpenTelemetry collector interfaces.
- ML & Analytics: Predictive capacity forecasting algorithms that calculate disk space exhaustion dates and process memory leak trajectories.
- Deployment Types: Cross-platform lightweight host agents (Linux, Windows, macOS, FreeBSD) and Kubernetes DaemonSets.
3. Application Performance Monitoring (APM Insight)
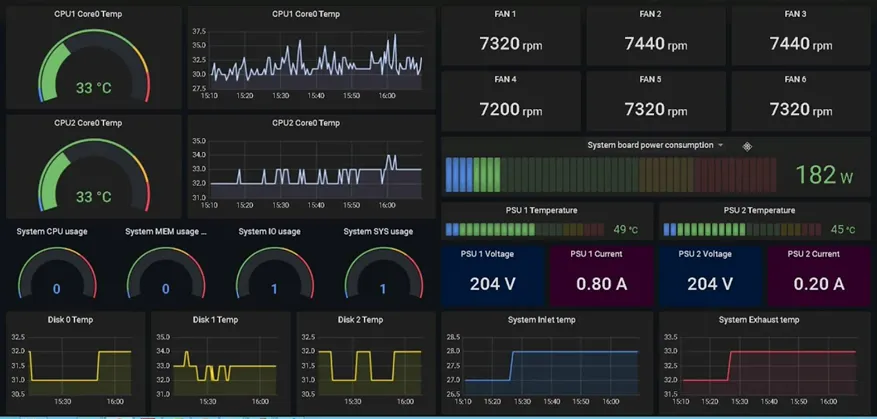
Site24x7 APM Insight provides code-level visibility into distributed web applications by intercepting thread execution paths and tracking database query latencies. Engineers analyzing production traces can evaluate the platform directly via Site24x7 to isolate code bottlenecks, unhandled exceptions, and third-party API dependencies.
- APIs & Protocols: Bytecode instrumentation for Java, .NET, Node.js, Python, PHP, and Ruby, plus OpenTelemetry gRPC exporters.
- ML & Analytics: Automatic distributed transaction map generation and algorithmic root-cause analysis (RCA) tree synthesis.
- Deployment Types: In-process language runtime agents combined with SaaS time-series indexing backends.
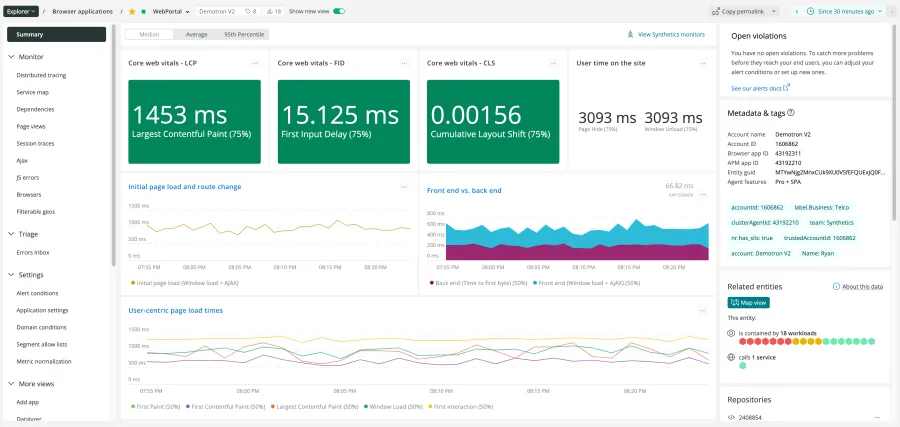
4. Real User Monitoring (RUM) & Frontend Web Vitals
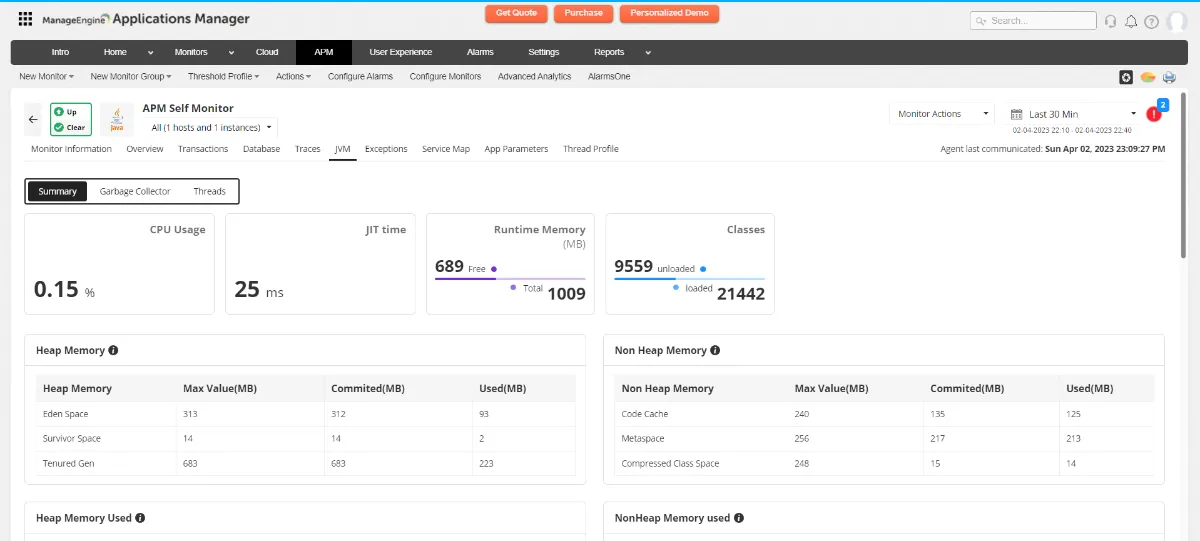
Site24x7 RUM captures actual user interaction performance metrics directly from client browser environments in real time. It evaluates Core Web Vitals—including Largest Contentful Paint (LCP), Interaction to Next Paint (INP), and Cumulative Layout Shift (CLS)—segmented by browser engine, geographic location, device type, and ISP network.
- APIs & Protocols: Asynchronous JavaScript injection snippet using W3C Navigation Timing and Resource Timing APIs.
- ML & Analytics: User session clustering and anomaly detection on client-side JS error rates and AJAX payload latencies.
- Deployment Types: Edge CDN-hosted client script integrated into web frontend HTML templates or Single Page Application (SPA) frameworks.
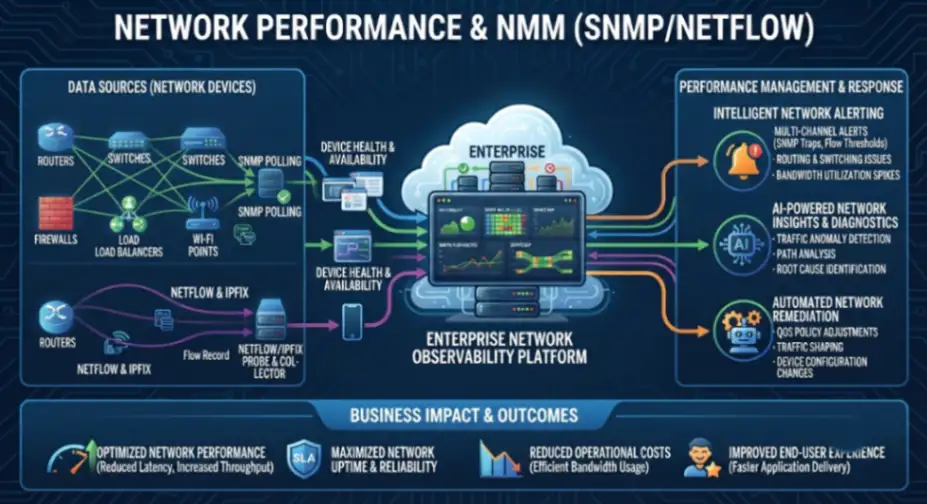
5. Network Performance & NMM (SNMP/NetFlow)
The Network Monitoring module discovers and maps physical and virtual network infrastructure devices, including routers, switches, firewalls, and load balancers. It monitors interface traffic volume, packet drops, buffer errors, CPU/memory utilization, and flow records to optimize bandwidth consumption.
- APIs & Protocols: SNMP v1/v2c/v3, NetFlow, sFlow, IPFIX, J-Flow, and ICMP ping probes.
- ML & Analytics: Traffic baseline analysis engine detecting unauthorized bandwidth spikes and DDoS traffic distribution patterns.
- Deployment Types: On-Premises Network Poller Gateway agent forwarding compressed telemetry to the Site24x7 cloud console.
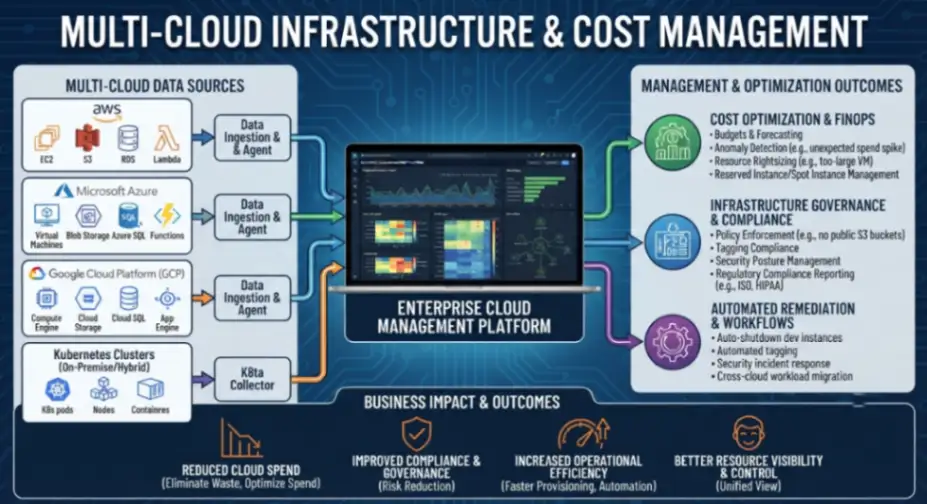
6. Multi-Cloud Infrastructure & Cost Management
Site24x7 provides native multi-cloud observability across Amazon Web Services (AWS), Microsoft Azure, and Google Cloud Platform (GCP). It aggregates resource health, serverless execution metrics (e.g., AWS Lambda, Azure Functions), and cloud spend analytics to prevent budget overruns.
- APIs & Protocols: Cloud provider REST management APIs (AWS CloudWatch API, Azure Monitor API, GCP Cloud Monitoring API).
- ML & Analytics: Predictive billing forecast models and automated idle resource detection algorithms for cloud cost optimization.
- Deployment Types: Agentless API-to-API IAM role federation and service principal integration.
7. Centralized Log Management & Analytics
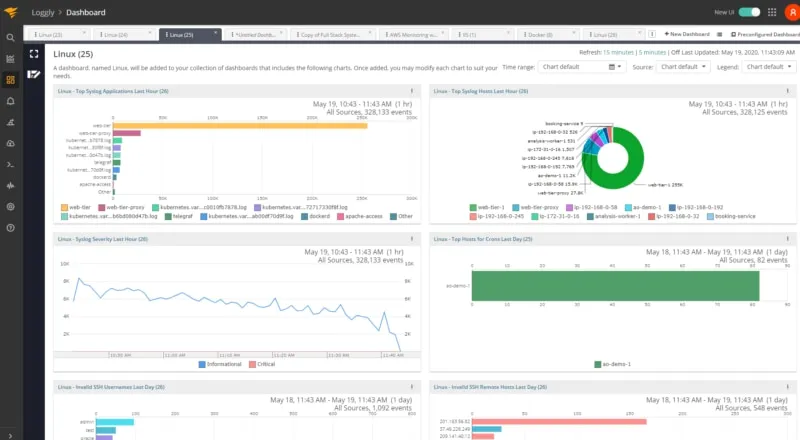
The centralized log engine collects, parses, and indexes application, system, and network logs across enterprise hybrid topologies. It normalizes unstructured log data into structured key-value pairs, enabling rapid searching, metric extraction, and correlation with server performance anomalies.
- APIs & Protocols: Syslog (UDP/TCP/TLS), Fluentd, Logstash, HTTP Source API, and Windows Event Log collector APIs.
- ML & Analytics: Log pattern clustering and unexpected log volume spike detection powered by machine learning algorithms.
- Deployment Types: SaaS-hosted log indexing engine with lightweight agent log forwarders or serverless log shippers.
Frequently Asked Questions
How does Site24x7 handle data security and compliance for enterprise cloud monitoring telemetry?
Site24x7 complies with strict global regulatory frameworks, including ISO/IEC 27001, SOC 2 Type II, GDPR, and HIPAA. Telemetry data transmitted between local agents/monitors and the Site24x7 cloud platform is encrypted in transit using TLS 1.3 protocols, while collected metrics and log archives are encrypted at rest using AES-256 standards.
What is the difference between Site24x7 APM Insight agents and synthetic transaction monitoring?
Synthetic transaction monitoring uses external headless scripts to simulate user workflows from global locations to measure external availability and SLAs. In contrast, APM Insight utilizes runtime bytecode instrumentation agents installed directly within application servers (e.g., JVM, CLR) to trace internal method calls, memory allocations, and SQL query executions.
How does Site24x7 integrate with IT Service Management (ITSM) and incident response workflows?
Site24x7 features native, bi-directional webhook integrations with popular ITSM, NOC, and collaboration tools—such as ServiceNow, Jira Service Management, PagerDuty, Opsgenie, Slack, and Microsoft Teams. Upon metric threshold breach, it automatically triggers webhook payloads to open tickets, route alerts based on on-call schedules, and execute automated IT remediation tasks.
Advertisement