Enterprise Technical Review: Sematext Full-Stack Observability & Unified Telemetry Architecture
Advertisement
Enterprise Technical Review: Sematext Full-Stack Observability & Unified Telemetry Architecture
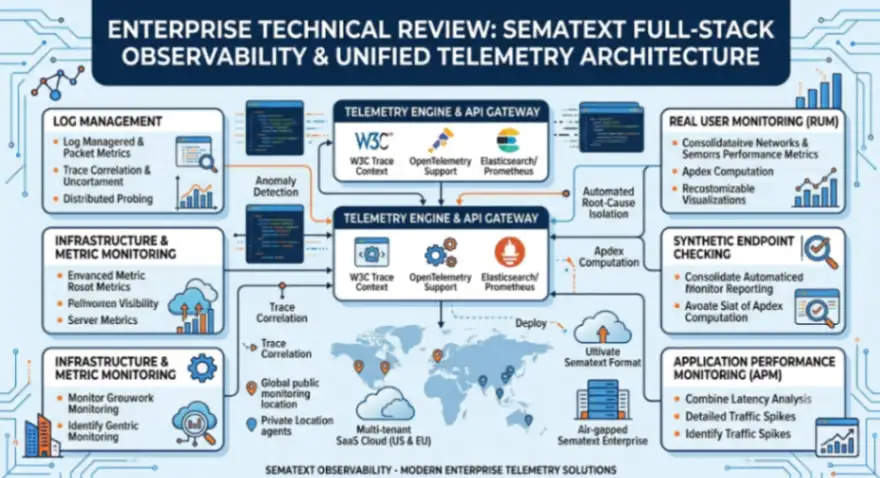
As modern distributed architectures scale across multi-cloud topologies, maintaining cross-stack correlation between infrastructure metrics, application trace spans, and structured log events becomes critical. In alignment with open standards defined by organizations such as the W3C for distributed tracing context propagation, Sematext provides a highly integrated telemetry stack designed to eliminate data silos and accelerate mean time to resolution (MTTR). This comprehensive technical review analyzes the core functional modules that constitute the complete Sematext observability engine.
1. Sematext Logs (Centralized Log Management)
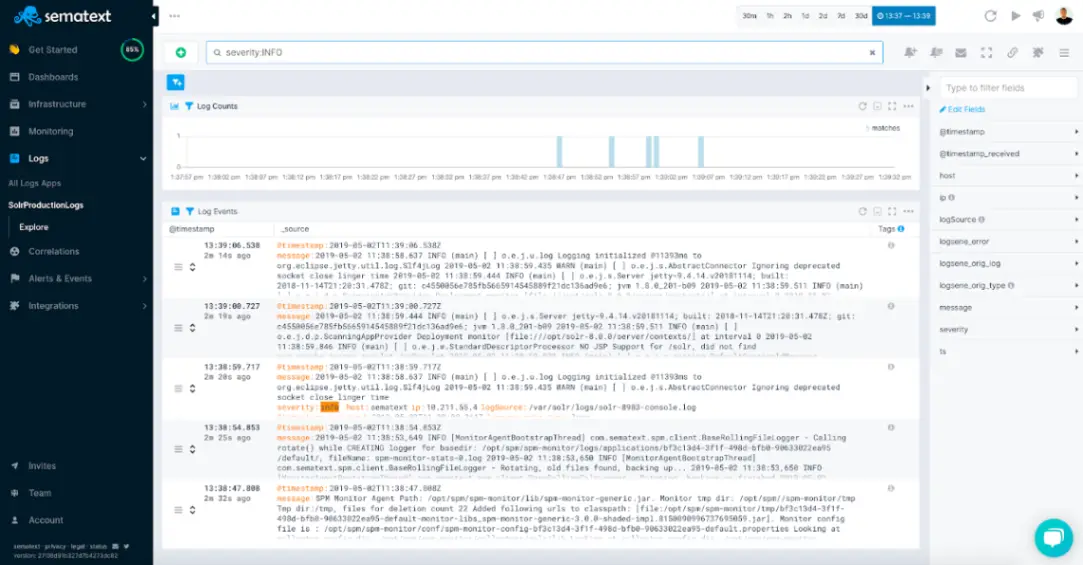
Sematext Logs provides high-throughput log aggregation, indexing, and real-time structured search built around native Elasticsearch REST API compatibility. It processes unstructured log streams from containers, daemons, and cloud services, automatically extracting JSON fields and enabling live tailing alongside automated alert processing.
- Probing & Telemetry APIs: Native Elasticsearch and OpenSearch API compliance for seamless ingestion via Logstash, Fluentd, Vector, and Filebeat.
- Anomaly Engine: Machine-learning-based statistical log pattern detection that automatically categorizes incoming log bursts and surfaces anomalous error spikes.
- Deployment Model: Multi-tenant SaaS cloud (US & EU regions) or completely air-gapped on-premises software via Sematext Enterprise.
2. Sematext Infrastructure & Metric Monitoring
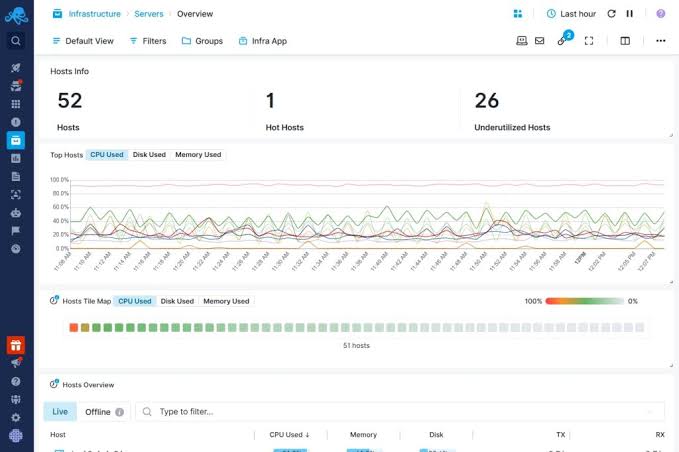
Sematext Infrastructure Monitoring captures high-cardinality performance metrics from servers, Kubernetes clusters, databases, and message brokers via lightweight collectors. The engine maintains real-time tracking of CPU, memory, network I/O, and storage IOPS, dynamically mapping host dependencies across physical and virtualized hardware layers.
- Probing & Telemetry APIs: OpenTelemetry collector integration alongside native Prometheus scrape endpoints and RESTful metric query APIs.
- Anomaly Engine: Dynamic thresholding algorithms evaluating historic time-series baselines to trigger proactive resource exhaustion alerts.
- Deployment Model: Lightweight host-level daemon (Sematext Agent) deployed via Docker, Kubernetes DaemonSets, Helm, or bare-metal packages.
3. Sematext Experience (Real User Monitoring - RUM)
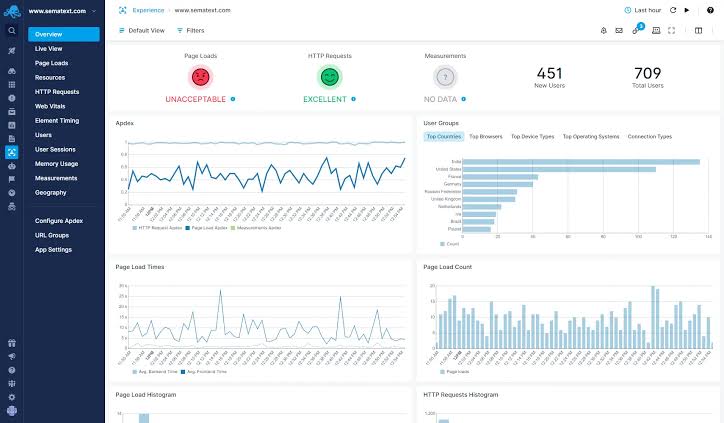
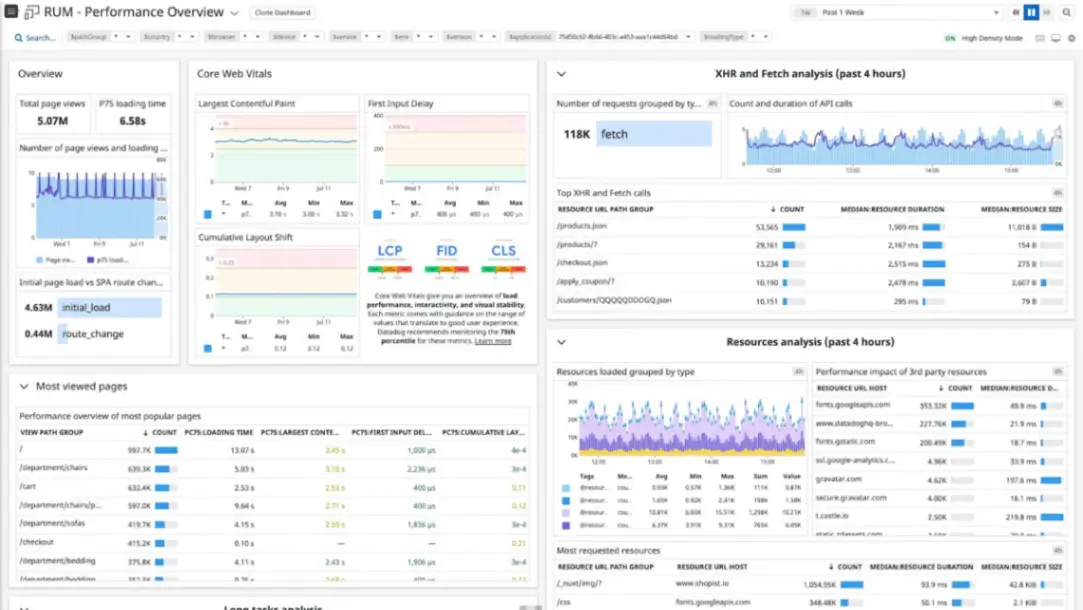
Sematext Experience delivers real-time front-end performance analytics by measuring actual user interactions across web applications and single-page applications (SPAs). It monitors front-end JavaScript execution errors, page load latency distributions, resource waterfall bottlenecks, and Core Web Vitals to pinpoint user-impacting performance degradation.
- Probing & Telemetry APIs: Asynchronous client-side JavaScript snippet API supporting custom user tracking parameters and single-page application route change hooks.
- Anomaly Engine: Automated Apdex (Application Performance Index) rating computation combined with statistical error frequency anomaly detection.
- Deployment Model: Cloud-managed script injection or self-hosted edge proxy delivery for enterprise data privacy compliance.
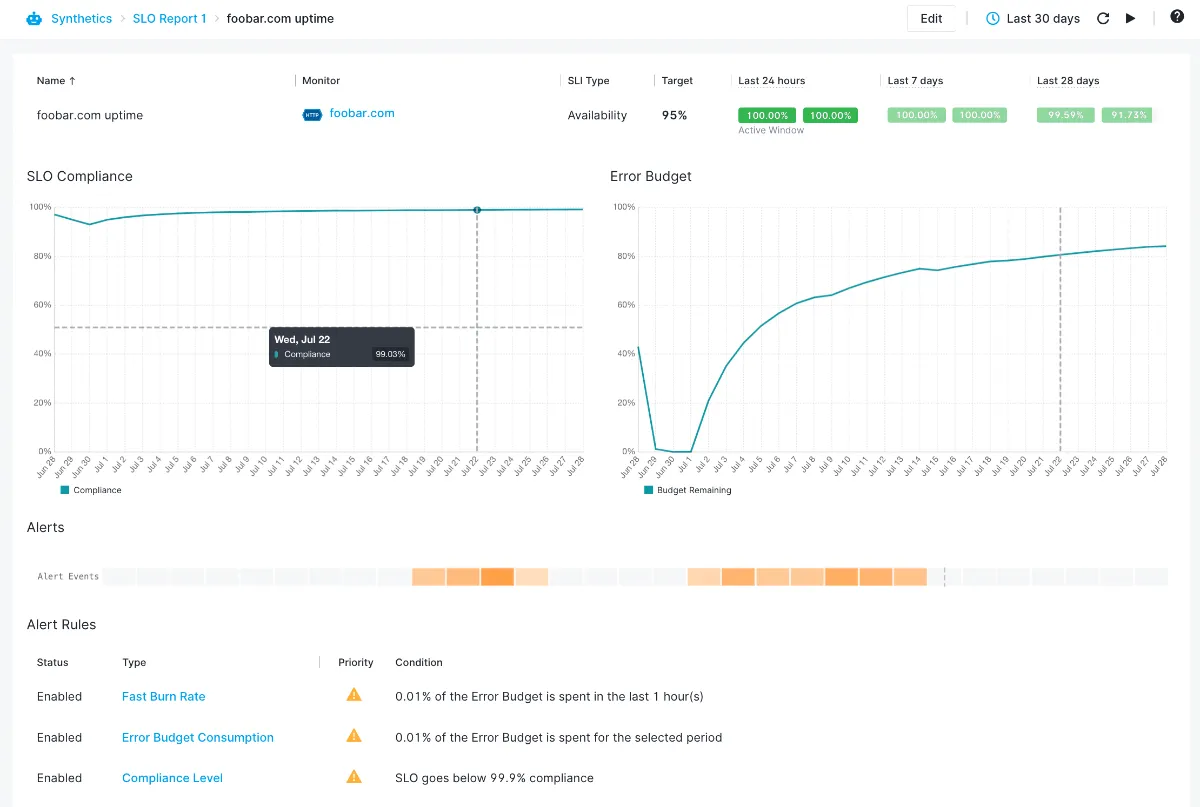
4. Sematext Synthetics (Synthetic Network & API Monitoring)
Sematext Synthetics executes automated, scripted network and browser-based checks from global vantage points to monitor endpoint availability, HTTP status responses, and SSL/TLS certificate validity. It simulates multi-step user journeys and API transaction workflows to validate system uptime before service degradation impacts active end users.
- Probing & Telemetry APIs: Programmable REST API for automated check creation, webhook alert payload forwarding, and CI/CD deployment testing integrations.
- Anomaly Engine: Multi-location verification logic that validates failing synthetic probes against cross-node health checks to eliminate false-positive alerts.
- Deployment Model: Global public monitoring locations managed by Sematext, plus Private Location agents for internal network probing.
5. Sematext Tracing (Application Performance Monitoring - APM)
Sematext Tracing provides deep transaction profiling and distributed tracing to map microservice request flows across distributed backend services. It captures end-to-end trace spans, database query execution times, external HTTP call latencies, and unhandled backend exceptions to highlight application bottlenecks.
- Probing & Telemetry APIs: Full support for W3C Trace Context and OpenTelemetry standards with language-specific auto-instrumentation agents (Java, Node.js, Python, Go).
- Anomaly Engine: Automated transaction baseline tracking that highlights latency outliers and high-error execution paths across service dependency trees.
- Deployment Model: In-process runtime bytecode manipulation agents forwarding trace spans asynchronously to Sematext cloud or enterprise storage engines.
6. Unified Dashboards & Cross-Metric Correlation Engine
The Unified Dashboard module serves as the central visualization and analysis layer, allowing engineers to correlate logs, metrics, traces, and synthetic alerts within a single pane of glass. By synchronizing time-series timeframes across disparate telemetry sources, users can drill down from a synthetic alert directly into associated APM traces and system log lines.
- Probing & Telemetry APIs: Flexible Dashboard-as-Code JSON configuration export/import APIs with support for custom widget metrics queries.
- Anomaly Engine: Unified alert manager utilizing Boolean query combinations to trigger multi-channel alerts across Slack, PagerDuty, VictorOps, and webhooks.
- Deployment Model: Fully integrated, browser-based web application component available across all SaaS and Enterprise instances.
Frequently Asked Questions
How does Sematext handle data privacy and compliance for enterprise log monitoring?
Sematext provides built-in data masking and anonymization pipelines to filter sensitive PII, credit card data, and credentials before logs are indexed. Additionally, organizations can choose data residency within EU or US cloud regions, or deploy Sematext Enterprise on-premises within air-gapped environments to comply with GDPR, HIPAA, and SOC 2 requirements.
Can Sematext ingest telemetry directly from existing OpenTelemetry collectors?
Yes, Sematext natively supports OpenTelemetry standards across traces, metrics, and logs. Organizations can configure standard OpenTelemetry Collectors to export data directly to Sematext endpoints without replacing existing instrumentation libraries or re-architecting telemetry pipelines.
What is the primary architectural advantage of choosing Sematext over fragmented point monitoring tools?
The main architectural advantage is unified telemetry correlation within a single engine. By linking infrastructure metrics, APM distributed traces, structured log events, and client-side RUM data under common application identifiers, Sematext eliminates context switching and drastically reduces Mean Time to Detection (MTTD) and MTTR during system incidents.
Advertisement