Production-Grade Traceroute Alternatives for Advanced Enterprise Path Analysis

Advertisement
Top 10 Enterprise Traceroute Alternatives for Hop-by-Hop Network Diagnostics & Path Visualization
Network path analysis has undergone a fundamental transformation over the last decade. Traditional diagnostic utilities—such as Windows tracert or Unix traceroute—were created for static, single-path IP routing environments. Today’s enterprise infrastructure spans distributed multi-cloud VPCs, Software-Defined Wide Area Networks (SD-WAN), and Software-as-a-Service (SaaS) endpoints protected by zero-trust security perimeters. Because legacy tools rely exclusively on sequential ICMP Echo Requests or UDP packets with incrementing Time-To-Live (TTL) values, intermediate network security appliances frequently rate-limit or discard these probes. The result is a flood of unhelpful * * * Request Timed Out outputs that mask the root cause of packet loss, jitter, and latency degradation. To maintain operational performance standards defined by bodies like the IEEE, organizations must modernize their network diagnostic toolsets with active path visualization platforms.
The Architectural Failure of Legacy Traceroute in Modern Infrastructure
Understanding why standard traceroute tools fail in production environments requires examining their underlying operational mechanics. Standard Unix traceroute sends UDP datagrams to high-numbered ports (typically 33434 to 33534), while Windows tracert utilizes ICMP Echo Request messages. Both tools increment the IP header TTL field starting at 1. When a router receives a packet with TTL=1, it decrements the TTL to 0, discards the datagram, and returns an ICMP Time Exceeded message (Type 11, Code 0) back to the source IP address. By measuring the Round-Trip Time (RTT) of these ICMP responses, the client constructs a step-by-step path list.
In contemporary enterprise routing environments, this model breaks down due to four primary architectural factors:
- Equal-Cost Multi-Path (ECMP) Hash Misalignment: Modern core routers load-balance traffic across multiple physical links by hashing 5-tuple packet header fields (Source IP, Destination IP, Source Port, Destination Port, Protocol). Because classic traceroute increments destination UDP ports or ICMP sequence numbers for every probe, different hops on the same probe run may traverse entirely different physical paths, creating artificial and non-existent topology maps.
- Stateful Firewall & Control Plane Policing (CoPP): Modern core switch and router control planes protect their processing CPUs by severely rate-limiting ICMP generation. Even when transit traffic flows without impairment, transit routers drop diagnostic ICMP responses, producing false-positive indicators of packet loss.
- Multi-Protocol Label Switching (MPLS) & Tunnel Obfuscation: Core service provider networks utilize MPLS Label Switched Paths (LSPs) or IPsec/GRE encapsulation. Without explicit TTL propagation enabled across the provider core, the internal transit hops remain completely invisible to classic client-side traceroute probes.
- Asymmetric Return Path Obfuscation: IP routing is inherently destination-based and asymmetric. A traceroute probe measures the forward path combined with an entirely different return path taken by the ICMP Time Exceeded packet. When latency spikes occur, legacy tools cannot differentiate between forward path degradation and return path congestion.
1. SolarWinds Traceroute NG
SolarWinds Traceroute NG is an enterprise CLI-driven diagnostic utility explicitly engineered to overcome the limitations of classic traceroute through continuous multi-protocol path probing and rapid topological convergence. The application performs non-destructive hop discovery across both IPv4 and IPv6 dual-stack environments in under three seconds.
- Multi-Protocol Probing Engine: Allows network operators to dynamically switch between ICMP and TCP SYN probe modes, enabling targeted path tracing against specific open service ports (e.g., TCP port 443 or 80) to bypass ICMP firewall blocks.
- Dynamic Path Mutation Detection: Continuously evaluates route stability and instantly alerts operators to route flaps, path changes, or BGP hops shifting in real-time through custom Terminate, Warn, or Notify triggers.
- Synchronized Path Telemetry: Continuously computes hop-by-hop metrics including current latency, historical average latency, percentage packet loss, and fully qualified domain name (FQDN) reverse lookup data without interrupting running traces.

2. Site24x7 Network Monitoring
Site24x7 offers an all-in-one cloud-managed monitoring suite that blends synthetic path analysis with continuous flow-based visibility. Built for hybrid cloud topologies, Site24x7 deploys lightweight on-premise and cloud polling agents that conduct active route tracing and correlate latency bottlenecks against underlying infrastructure resource usage.
- Automated NetFlow & SFlow Integration: Automatically discovers, categorizes, and registers flow-enabled interfaces across subnets to map traffic density alongside network path hops.
- Multi-Vector Traffic Filtering: Enables network engineers to isolate specific performance degradation vectors by filtering transit data across IP addresses, active interfaces, network protocols, and specific application layers.
- Extensive Enterprise SaaS Ecosystem: Connects hop analysis alerts directly into automated incident response pipelines, native webhooks, and enterprise ITSM systems. Evaluators can access a production trial through the official Site24x7 Platform.
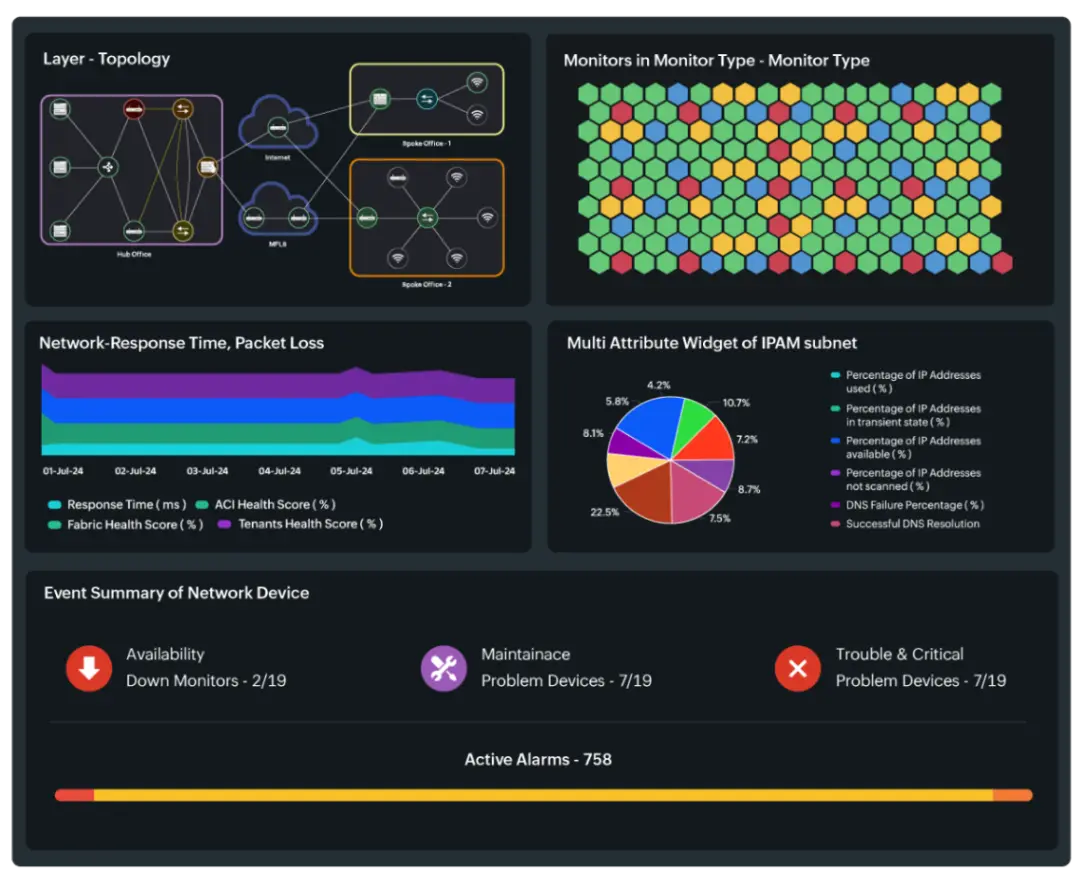
3. Cisco ThousandEyes
Cisco ThousandEyes is an industry-standard enterprise path visibility platform designed to deliver deep, end-to-end telemetry across internal networks, ISP backbones, public cloud environments, and SaaS applications. Utilizing a global network of Enterprise, Cloud, and Endpoint agents, ThousandEyes creates dynamic algorithmic path maps using proprietary active probing techniques.
- Algorithmic Path Visualization: Correlates Layer 3 routing paths with Layer 2 physical topology, explicitly identifying ECMP load-balancing splits, MPLS label stacks, and underlying ISP peering relationships.
- BGP Route Visualization: Continuously ingests global BGP routing table feeds to overlay real-time BGP path changes, route leaks, and prefix withdrawals directly onto latency and packet loss timeline maps.
- Synthetic Application Transaction Mapping: Combines network hop diagnostics with synthetic browser transactions to show exactly how underlying routing changes impact HTTP/HTTPS application load times and end-user experience.
4. Catchpoint Network Experience
Catchpoint Network Experience is an enterprise performance monitoring platform built around an expansive global monitoring footprint. Catchpoint’s diagnostic engine focuses on synthetic network path monitoring, providing detailed visibility into DNS resolution paths, BGP routing stability, and high-frequency TCP/UDP path tracing.
- Global Synthetic Probing Network: Deploys thousands of active testing nodes across thousands of global ISPs, cloud datacenters, and last-mile cellular networks to measure bidirectional path performance.
- Advanced Micro-Outage Detection: Executes high-frequency probing cycles down to second-level granular intervals to capture transient packet drops, micro-burst congestion, and temporary route flaps that standard tools miss.
- Smart Path Convergence Engine: Differentiates between enterprise edge firewall blocks, intermediary ISP core drops, and destination application server response degradation using automated heuristic root-cause analysis models.
5. MTR (Matt's Traceroute) & WinMTR
MTR (and its Windows GUI counterpart, WinMTR) is a ubiquitous open-source network diagnostic tool that merges the functionality of traceroute and ping into a single continuous network path profiling utility. MTR sends a continuous stream of ICMP, UDP, or TCP probes with incrementing TTLs to calculate rolling statistical distributions for every hop along the route.
- Continuous Statistical Path Profiling: Generates real-time, rolling statistical distributions—including minimum, maximum, mean, standard deviation, and percentage packet loss—for every single hop simultaneously.
- Protocol & Port Customization: Supports ICMP Echo, UDP datagram, and TCP SYN probe modes, allowing operators to adjust payload size, bit fields, and inter-probe intervals to pinpoint rate-limiting thresholds.
- Lightweight Multi-Platform Deployment: Runs natively across Linux, macOS, and Windows operating systems with near-zero overhead, making it an essential utility for rapid command-line troubleshooting.
6. Datadog Network Performance Monitoring (NPM)
Datadog NPM is a cloud-native network observability solution that leverages eBPF (Extended Berkeley Packet Filter) technology embedded directly inside the Linux kernel. Instead of relying solely on synthetic ping probes, Datadog inspects actual workload TCP socket traffic in real-time, tracking hop-by-hop dependencies across cloud instances, Kubernetes pods, and microservices.
- Kernel-Level eBPF Path Tracking: Inspects active socket connections at the kernel layer with negligible CPU overhead, generating real-time topology maps between endpoints without requiring code instrumentation.
- Container-Aware Topology Mapping: Automatically tracks network dependencies down to individual container IDs, Kubernetes services, process names, and cloud availability zones.
- Integrated Synthetic Network Tests: Complements live traffic monitoring with scheduled synthetic network path tests targeting external APIs, SaaS endpoints, and internal hybrid VPN tunnels.
7. PRTG Network Monitor by Paessler
PRTG Network Monitor is an enterprise infrastructure management solution designed around an extensible, sensor-based monitoring architecture. PRTG includes dedicated traceroute and ping sensors that continuously poll infrastructure nodes, visualize topology shifts, and trigger automated alerting workflows upon performance degradation.
- Modular Sensor Architecture: Features pre-configured Ping, Traceroute, QoS, and NetFlow sensors that can be customized to monitor both internal LAN segments and external WAN connections.
- Automated Network Auto-Discovery: Scans assigned IP subnets to automatically build interactive topology maps that depict active switches, routers, firewalls, and host devices.
- Multi-Threshold Alerting Engine: Supports customizable warning and error thresholds based on latency standard deviations, threshold breaches, or hop count increases, delivering notifications via SMS, email, or webhook.
8. Kentik Network Observability
Kentik is a SaaS-based network analytics and observability platform engineered for network operations, service providers, and digital enterprise teams. Kentik ingests massive volumes of unstructured telemetry—including NetFlow, IPFIX, sFlow, cloud VPC flow logs, and streaming telemetry—and combines it with active synthetic network testing.
- Flow-Enriched Synthetic Probing: Automatically initiates targeted synthetic traceroutes based on live traffic volume spikes, mapping high-bandwidth flow paths directly to physical and logical hop links.
- Autonomous Internet Path Telemetry: Monitors major internet transit paths, SaaS applications, and public cloud interconnects globally to proactively detect BGP route anomalies and regional ISP outages.
- Multi-Cloud VPC Path Inspection: Seamlessly ingests AWS VPC Flow Logs, Azure Network Watcher flow data, and GCP Flow Logs to visualize inter-cloud and hybrid-cloud routing topology paths.
9. PathSolutions Total Network Visibility
PathSolutions provides automated network performance monitoring and diagnostic solutions designed to eliminate operational blind spots. Operating on a holistic analysis paradigm, PathSolutions Continuously monitors every switch port, router interface, and WAN connection across the enterprise to automatically pinpoint the root cause of performance degradation.
- Automated Root-Cause Diagnostics: Inspects switch and router error counters (e.g., CRC errors, frame alignment issues, buffer drops) along the path to explain exactly why latency or packet loss is occurring at a specific hop.
- ASIC & Buffer Drop Analysis: Tracks hardware-level micro-burst queue drops and interface utilization spikes across all transit switches in the physical path.
- Inline VoIP & UC Quality Mapping: Specifically measures network path suitability for real-time traffic, calculating MOS (Mean Opinion Score), jitter buffer overruns, and packet reordering across every hop.
10. PerfSONAR
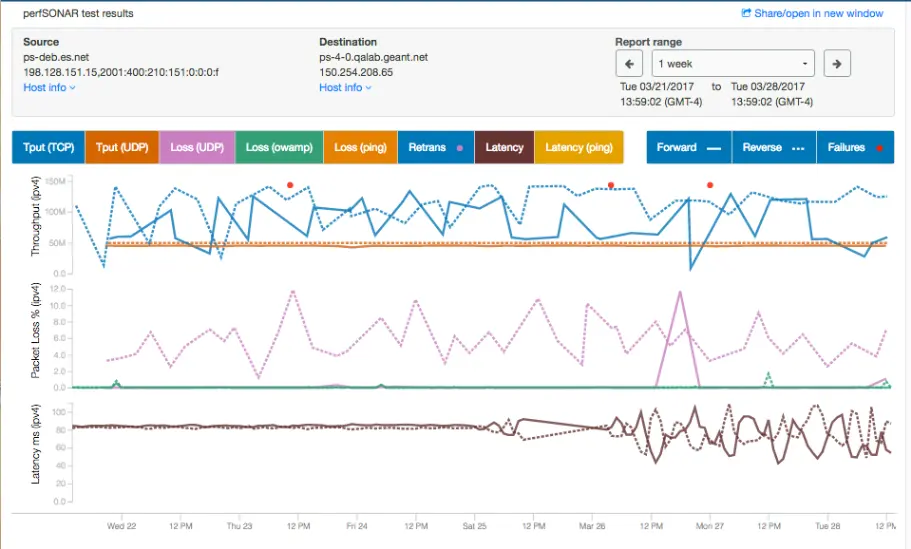
PerfSONAR is an open-source, federated network measurement infrastructure widely deployed across high-bandwidth research, academic, and scientific network backbones globally. Designed to establish end-to-end performance expectations across federated administrative domains, perfSONAR executes precise, scheduled network measurements.
- Federated Multi-Domain Path Measurement: Enables independent network domains to share standardized path performance metrics without exposing sensitive internal network configurations.
- OWAMP & TWAMP Protocol Integration: Employs One-Way Active Measurement Protocol (OWAMP) and Two-Way Active Measurement Protocol (TWAMP) to measure directional latency and jitter asymmetry across complex paths.
- High-Precision Throughput & Trace Probing: Coordinates throughput testing (via iperf3) alongside path trace diagnostics (via tracepath and Paris-Traceroute) to measure path performance under heavy load conditions.
Enterprise Feature Comparison Matrix
Selecting the appropriate traceroute alternative depends heavily on deployment architecture, monitoring requirements, and infrastructure complexity. The following matrix compares key operational capabilities across all ten platforms:
| Platform | Primary Deployment Model | Supported Probe Protocols | Continuous Polling | Flow Log Integration | BGP Topology Mapping |
|---|---|---|---|---|---|
| SolarWinds Traceroute NG | On-Premise CLI (Windows) | ICMP, TCP | Yes | No | No |
| Site24x7 | SaaS / Hybrid Agent | ICMP, TCP, UDP | Yes | Yes (NetFlow/sFlow) | No |
| Cisco ThousandEyes | SaaS / Distributed Agents | ICMP, TCP, UDP | Yes | No | Yes |
| Catchpoint | SaaS / Global Synthetic Nodes | ICMP, TCP, UDP | Yes | No | Yes |
| MTR / WinMTR | On-Premise CLI / Desktop GUI | ICMP, TCP, UDP | Yes | No | No |
| Datadog NPM | SaaS / eBPF Kernel Agent | eBPF Socket / Synthetic TCP | Yes | Yes (Cloud Flow) | No |
| PRTG Network Monitor | On-Premise / Windows Server | ICMP, TCP, UDP | Yes | Yes (NetFlow/IPFIX) | No |
| Kentik | SaaS / Cloud Native | ICMP, TCP, UDP | Yes | Yes (Native Flow) | Yes |
| PathSolutions | On-Premise Virtual Appliance | ICMP, SNMP, Port Probing | Yes | No | No |
| PerfSONAR | Open-Source Linux Appliance | OWAMP, TWAMP, TCP, UDP | Yes | No | No |
Architectural Implementation Framework for Enterprise Continuous Path Analysis
To establish a resilient network path diagnostics strategy across enterprise environments, network architects should follow a structured three-tier operational framework:
1. Synthetic Agent Placement Strategy
Deploy synthetic probing agents across strategically chosen network boundary points. Place agents within internal core subnets, cloud VPCs/VNets, major branch offices, and remote worker endpoints. Ensure agents send bidirectional TCP SYN probes on application ports (e.g., TCP 443) toward critical internal and external SaaS endpoints to maintain real-time route baseline metrics.
2. Adaptive Probe Frequency and Thresholding
Avoid static, low-frequency ping polling. Configure path analysis platforms to dynamically increase probe frequencies during anomalous latency events. Set statistical alerting rules based on standard deviation multipliers (e.g., alerting when latency exceeds 3 sigma above the rolling 7-day baseline) rather than static numerical thresholds, preventing false alerts caused by normal diurnal traffic fluctuations.
3. AIOps and Incident Management Pipeline Integration
Expose synthetic path monitoring metrics to centralized AIOps engine pipelines and ITSM workflow platforms using REST APIs and Webhooks. Automate ticket generation and dynamic path packet captures whenever route mutation, packet loss delta spikes, or BGP path changes occur, significantly reducing Mean Time To Resolution (MTTR).
Frequently Asked Questions
What is the primary technical difference between ICMP, UDP, and TCP traceroute probes?
ICMP probes use standard echo requests that are heavily rate-limited by network switch control planes and blocked by firewalls. UDP probes target unused high-numbered ports but are frequently dropped at perimeter edge devices. TCP traceroute probes send standard TCP SYN packets to established service ports (such as port 443 for HTTPS), mimicking real application traffic to bypass firewalls and navigate stateful inspection devices accurately.
How does Equal-Cost Multi-Path (ECMP) routing cause inaccurate results in traditional traceroute?
ECMP routers distribute traffic across multiple equal-cost physical links by computing a hash over the packet's 5-tuple header (Source IP, Destination IP, Source Port, Destination Port, Protocol). Because classic traceroute utilities vary the destination port or sequence number with every packet, individual probes take entirely different physical paths. This causes the resulting trace output to display a confusing mashup of non-existent routing paths.
Why do intermediate hop timeouts not always indicate actual packet loss or network degradation?
Intermediate hop timeouts often occur because transit router CPUs are configured with Control Plane Policing (CoPP) rules that drop lower-priority diagnostic ICMP responses while continuing to forward regular data plane traffic at line rate. If subsequent hops respond with normal latencies and zero packet loss, the intermediate timeout is merely a control plane artifact, not a performance issue.
How do SaaS tools like ThousandEyes and Catchpoint monitor path performance inside public cloud environments?
These platforms deploy dedicated software agents inside public cloud datacenters (e.g., AWS VPCs, Azure VNets, GCP projects) alongside global Internet vantage points. They execute active TCP and UDP synthetic probing algorithms, combining hop data with cloud provider flow logs and real-time BGP routing tables to construct multi-layered visual topographies.
When should an enterprise choose MTR over an enterprise platform like Datadog or Cisco ThousandEyes?
MTR is an ideal, lightweight tool for ad-hoc, manual command-line diagnostics conducted by network engineers during live troubleshooting sessions. Enterprise SaaS platforms like Datadog or Cisco ThousandEyes are necessary when organizations require continuous historical telemetry, automated threshold alerting, multi-cloud dependency mapping, and integration with enterprise incident response systems.
Advertisement