Enterprise Network Architecture Guide: How to Diagnose, Isolate, and Fix Packet Loss
Advertisement
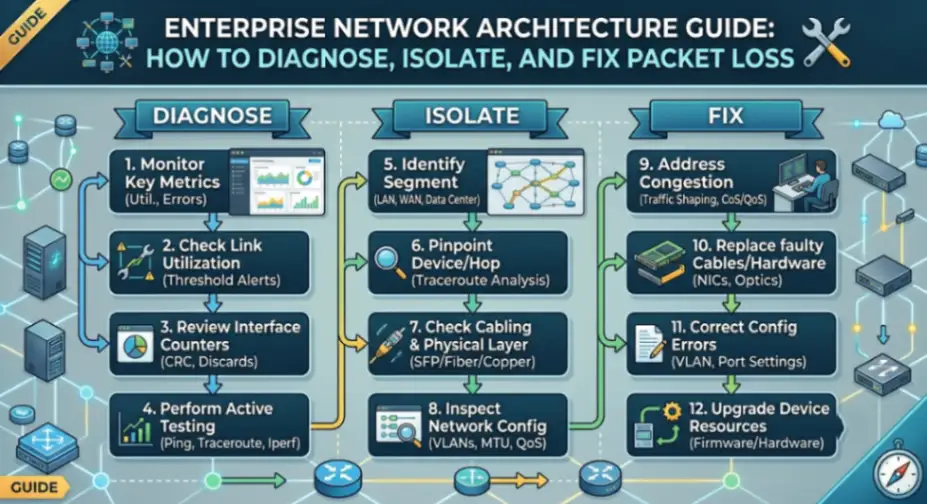
Enterprise Network Architecture Guide: How to Diagnose, Isolate, and Fix Packet Loss
Packet loss occurs when transmitted data payloads fail to reach their destination across IP infrastructure, forcing TCP retransmissions or degrading real-time UDP protocols like VoIP and video conferencing. Under standards defined by IEEE and IETF RFC 2544 Network Interconnect Benchmarking, network architects must continuously evaluate throughput, latency, and frame loss rates to prevent buffer bloat, interface saturation, and hardware frame check sequence (FCS) failures across core and edge infrastructure.
1. Diagnose Baseline Performance via Continuous MTR and Ping Diagnostics
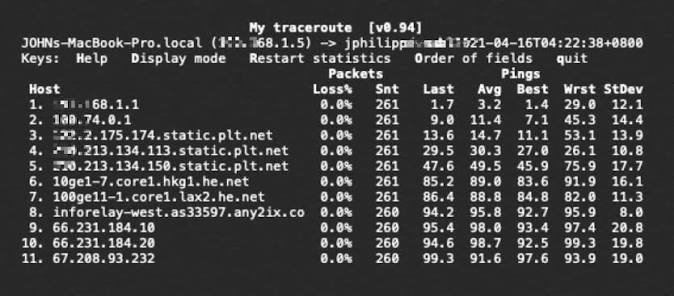
Establishing an accurate diagnostic baseline using continuous ICMP and UDP probes isolates whether packet drops stem from local network interface controllers or remote WAN transit providers. Analyzing multi-hop diagnostics distinguishes between true persistent loss and deprioritized ICMP rate-limiting on intermediate router control planes.
- APIs & Integration: CLI and scriptable execution wrappers supporting structured JSON export for telemetry ingestion into Prometheus or Grafana.
- AI & ML Models: Statistical anomaly scoring models that evaluate historical baseline packet loss against real-time probe variance.
- Deployment Types: Native terminal utilities across Linux, macOS, and Windows environments, complemented by distributed synthetic polling agents.
2. Power Cycle Network Equipment to Clear NAT Table Overflows
Cold rebooting consumer and enterprise edge hardware clears exhausted Network Address Translation (NAT) tables, bloated state memory, and CPU queue deadlocks. This resets physical network interface controller (NIC) chips and releases fragmented packet buffers causing tail-drop behavior.
- APIs & Integration: SNMP reboot commands, TR-069/USP management APIs, and power management integration via smart PDU REST APIs.
- AI & ML Models: Dynamic memory leak detection rules that trigger proactive maintenance reboot recommendations before buffer exhaustion occurs.
- Deployment Types: Firmware-embedded operational routines running directly on physical routers, modems, and managed switches.
3. Transition from Wireless Signal Paths to Shielded Ethernet Cables
Replacing high-latency Wi-Fi radio connections with structured Cat6/Cat6A cabling eliminates RF signal degradation, multipath interference, and co-channel contention. Wired physical layers provide dedicated full-duplex bandwidth, drastically lowering physical layer frame corruptions.
- APIs & Integration: Network interface management via WMI, Netsh, or Linux ethtool APIs for real-time link-state querying.
- AI & ML Models: Wireless channel optimization and dynamic frequency selection (DFS) machine learning models for fallback Wi-Fi channels.
- Deployment Types: Physical layer (Layer 1) hardware infrastructure using Category 6/6A RJ45 or fiber optic interconnects.
4. Replace Damaged Physical Cabling and Eliminate Duplex Mismatches
Physical cable damage or auto-negotiation failures often result in duplex mismatches, causing continuous collision errors and Frame Check Sequence (FCS) drops. Swapping compromised patch cords and explicitly pinning port speeds prevents physical CRC corruptions.
- APIs & Integration: SNMP MIB-II interface statistics APIs (IF-MIB) monitoring counter metrics like
ifInErrorsandifOutDiscards. - AI & ML Models: Physical layer fault isolation heuristics that correlate rising FCS counters with hardware interface degradation.
- Deployment Types: Physical network infrastructure deployed across enterprise switch fabrics and structured patch panels.
5. Apply Quality of Service (QoS) and Traffic Shaping Policies
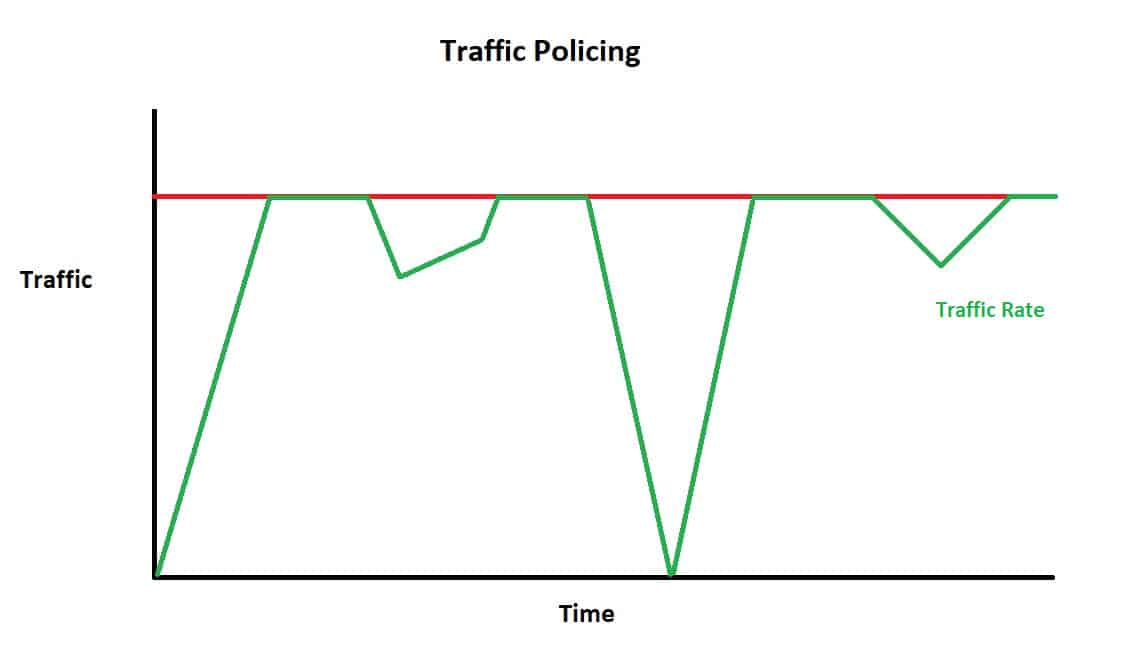
Implementing Quality of Service policies via Differentiated Services Code Point (DSCP) classification prioritizes delay-sensitive real-time UDP traffic over high-volume TCP file transfers. Traffic shaping and Weighted Random Early Detection (WRED) prevent bursty traffic from swamping switch queue buffers.
- APIs & Integration: OpenFlow REST APIs, Cisco NETCONF/YANG interface models, and API-driven SD-WAN policy orchestrators.
- AI & ML Models: Predictive bandwidth allocation models that dynamically adjust queue depth allocations based on egress saturation patterns.
- Deployment Types: On-premise managed edge routers, layer-3 switches, and cloud-managed SD-WAN edge appliances.
6. Update Router Firmware and Network Adapter Drivers
Upgrading network interface controller drivers and router operating system firmware patches known microcode memory leaks, TCP stack flaws, and buffer handling bugs. Updated driver binaries optimize packet ring buffer allocation for high-throughput network workloads.
- APIs & Integration: Automated vendor patch management APIs, Ansible network modules, and Redfish hardware management interfaces.
- AI & ML Models: Automated firmware health tracking systems that analyze vendor release notes against active crash log datasets.
- Deployment Types: OS-level driver installations for Windows/Linux hosts and vendor firmware flash images for network appliances.
7. Resolve MTU Size Mismatches and Packet Fragmentation
Incorrect Maximum Transmission Unit (MTU) sizing across VPN tunnels or encapsulated networks leads to IP packet fragmentation or dropped frames when the Don't Fragment (DF) bit is set. Path MTU Discovery (PMTUD) configuration ensures packets fit transport boundaries without router-level drops.
- APIs & Integration: ICMP Type 3 Code 4 (Fragmentation Needed) error messaging feedback loops and socket-level IP option control APIs.
- AI & ML Models: Automated MSS (Maximum Segment Size) clamping algorithms that dynamically infer optimal WAN MTU sizes.
- Deployment Types: Network layer configuration enforced on enterprise firewalls, router interfaces, and SD-WAN tunnels.
8. Deploy Enterprise Network Performance Management (NPM) Software
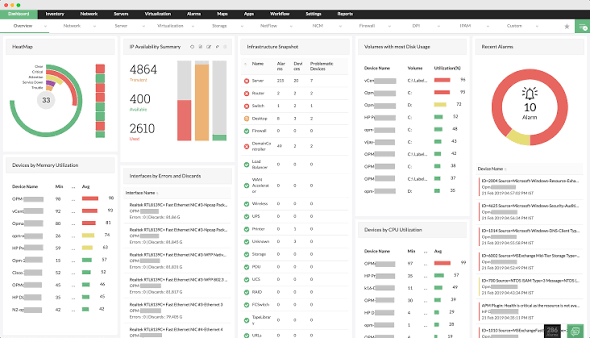
Enterprise NPM platforms monitor packet loss at scale by continuously analyzing SNMP counter metrics, NetFlow/IPFIX records, and active synthetic probes. Leveraging an end-to-end monitoring solution like Netdata allows SecOps teams to detect transient drops and isolate root causes across distributed infrastructures instantly.
- APIs & Integration: High-throughput gRPC and REST APIs for streaming telemetry into enterprise SIEMs, APMs, and alerting webhooks.
- AI & ML Models: Unsupervised machine learning models that correlate cross-stack metrics to isolate whether packet loss stems from application, server, or switch bottlenecks.
- Deployment Types: Cloud-native SaaS platforms, hybrid-cloud collectors, and on-premise containerized telemetry agents.
Frequently Asked Questions
What is an acceptable percentage of packet loss for enterprise networks?
For standard data transfers and web browsing, packet loss should ideally remain below 0.1%. However, for mission-critical real-time applications such as VoIP, video conferencing, and financial trading, packet loss must stay below 0.05% to avoid severe audio chopping, frame drops, and protocol retransmission latency.
How can I tell if packet loss is happening on my local network or with my ISP?
By running a multi-hop diagnostic utility like MTR or continuous ping tests to each hop along the path, you can observe where the loss begins. If loss appears on hop 1 (your local gateway router), the problem is within your LAN or local cabling. If loss starts several hops downstream and persists continuously across subsequent hops, the bottleneck lies within your ISP or upstream transit provider.
Why does TCP handle packet loss better than UDP?
TCP is a connection-oriented protocol that features built-in error checking, sequence numbers, and acknowledgment requirements (ACKs), allowing it to automatically retransmit dropped packets. UDP is connectionless and prioritizing speed over reliability without native retransmissions; thus, any dropped UDP packets are permanently lost unless handled by upper-layer application logic.
Advertisement