Comprehensive Guide to Network Monitoring Fundamentals and Architecture
Advertisement
Comprehensive Guide to Network Monitoring Fundamentals and Architecture
Establishing enterprise network observability requires a multi-layered telemetry framework that combines active synthetic polling with passive stream ingestion. Governed by standardized protocols defined by organizations like the IETF, effective monitoring relies on structured telemetry schemas, device-level agents, and centralized management consoles to maintain infrastructure resilience across physical, virtual, and multi-cloud environments.
1. Network Equipment (Switches and Routers)
Network equipment forms the backbone of data packet distribution and serves as the primary telemetry collection point for traffic traversal across physical and virtual topologies. Monitoring these core nodes provides direct insight into interface bandwidth utilization, buffer drops, and packet forwarding efficiency.
- API Integration: Exposes RESTconf, NETCONF, and gRPC telemetry interfaces alongside legacy CLI polling for programmatic telemetry retrieval.
- Deployment Types: Embedded firmware execution across bare-metal hardware switches, virtual routers, and cloud-native software-defined networks (SDN).
- ML & Analytics: Feeds interface queue drop counters and CRC error rates into ML anomaly-detection pipelines for predictive queue sizing.

2. Host Systems (OS Endpoints and Servers)
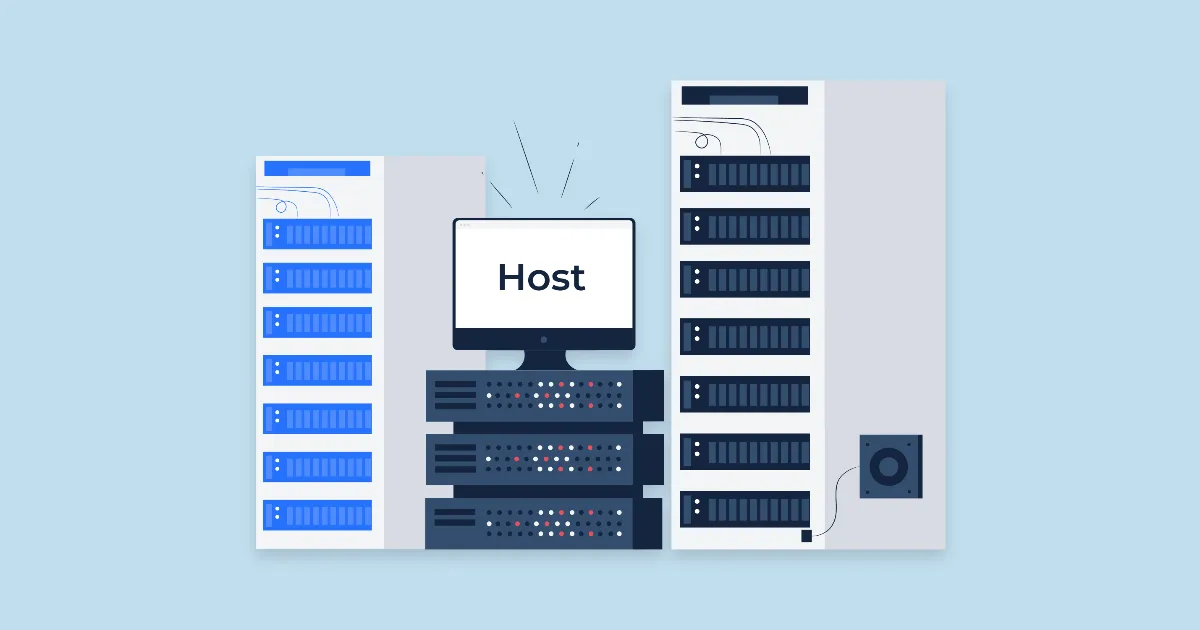
Host systems represent the edge endpoints and workload execution servers running enterprise operating systems such as Linux, Windows Server, and macOS. Telemetry from host systems isolates localized OS resource starvation from network transit latency during end-to-end performance degradation.
- API Integration: Ingests metrics via OS-native management APIs including WMI, eBPF, and Prometheus exporter endpoints.
- Deployment Types: Deployed via lightweight kernel-space agents, sidecar containers, or agentless SSH/WinRM management connections.
- ML & Analytics: Utilizes machine learning models to correlate host CPU/memory spikes with anomalous socket connection growth.
3. Simple Network Management Protocol (SNMP)
SNMP is an application-layer IP protocol operating over UDP that standardizes the exchange of management information between network devices and monitoring software. It enables both active polling (Get/GetNext requests) and asynchronous event reporting across heterogeneous infrastructure.
- Protocol Standards: Supports legacy SNMPv1/v2c community strings alongside secure SNMPv3 featuring AES encryption and HMAC authentication.
- Deployment Types: Universally supported protocol framework embedded directly into network appliances, hypervisors, and storage arrays.
- API & Exporting: Consolidated SNMP data streams can be ingested directly into RESTful monitoring pipelines and TSDB backends.
4. Management Information Base (MIB)
A Management Information Base (MIB) is a hierarchically organized, tree-structured database format that defines the manageable variables exposed by an SNMP device. Each variable within a MIB is assigned an Object Identifier (OID), ensuring universal data interpretation across multi-vendor equipment.
- Data Structuring: Organizes system parameters using Abstract Syntax Notation One (ASN.1) notation for standardized binary encoding.
- Deployment Types: Static text specification files loaded into SNMP Network Managers and local MIB interpreter engines.
- APIs & Customization: Enables custom MIB creation and programmatic OID mapping via vendor SDKs and developer parsing libraries.
5. SNMP Device Agent
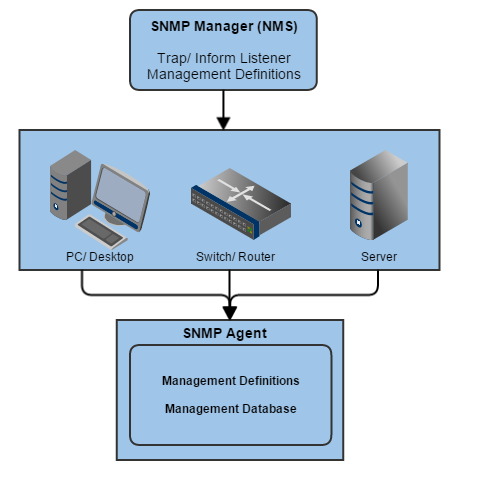
The SNMP Device Agent is a background process running locally on networking hardware that maintains a real-time copy of the local MIB database. When localized fault conditions or threshold breaches occur, the agent generates unprompted SNMP Trap or Inform messages to notify administrators.
- Event Notification: Autonomous transmission of UDP trap packets on port 162 upon detecting link-down states or high environmental temperatures.
- Deployment Types: Factory-installed software agent operating inside network device firmware and server hypervisors.
- ML & Analytics: Integrates with local system baselines to suppress transient noise traps before network transmission.
6. SNMP Network Manager
The SNMP Network Manager acts as the centralized collection console that periodically polls agent MIBs and listens for incoming asynchronous trap messages. It aggregates, translates, and persists raw OID values into historical trend databases and actionable operational dashboards.
- API Integration: Provides rich REST APIs and webhook integrations for automated ITSM ticketing and SIEM event ingestion. Enterprise teams often deploy centralized platforms like Site24x7 for unified hybrid monitoring.
- Deployment Types: Available as cloud-native SaaS platforms, containerized microservices, or high-availability on-premises appliances.
- ML & Analytics: Implements time-series forecasting algorithms to identify seasonal bandwidth exhaustion trends.
7. Ping (ICMP Echo Verification)
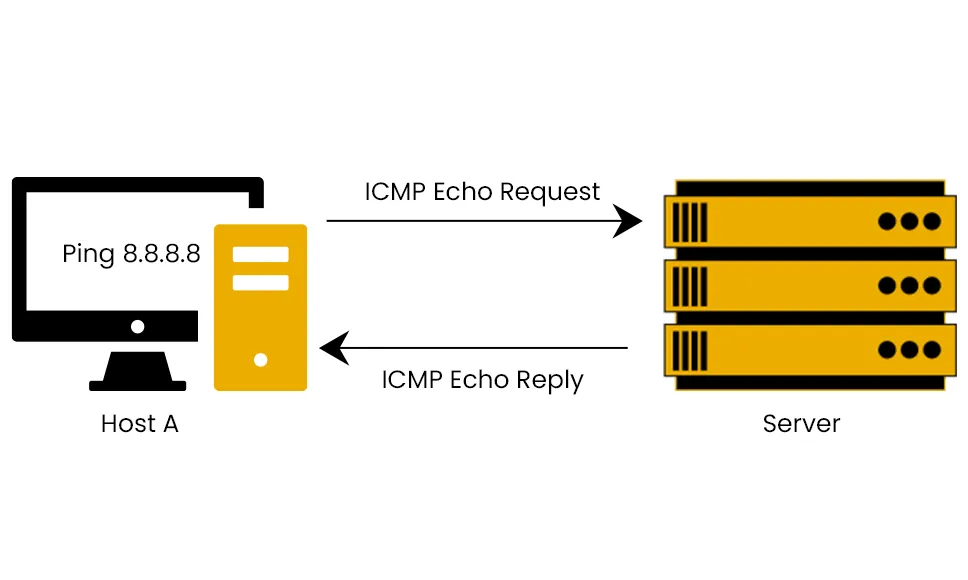
Ping is a fundamental utility that leverages ICMP Echo Request and Echo Reply messages to verify host reachability and measure round-trip time (RTT). Batch ping execution, known as a ping sweep, sequentially scans IP ranges to map active host allocations across network subnets.
- Protocol Engine: Direct layer-3 ICMP socket generation with configurable packet payload size, TTL values, and framing flags.
- Deployment Types: Native CLI utility present on all major operating systems, embedded into synthetic monitoring probes.
- ML & Analytics: Analyzes RTT variance (jitter) and packet loss percentages via automated statistical regression models.
8. Traceroute (ICMP Path Discovery)
Traceroute identifies the layer-3 routing path packets traverse to reach a target destination by incrementally increasing the Time-To-Live (TTL) field of outgoing packets. As intermediate routers drop expired packets, they return ICMP Time Exceeded messages, exposing each hop along the transit route.
- Diagnostic Mechanics: Supports ICMP, UDP, and TCP SYN probing modes to bypass restrictive transit firewall rules.
- Deployment Types: Cross-platform command-line tool integrated into automated network path analysis suites.
- ML & Analytics: Maps dynamic path changes over time to detect multi-homed BGP route flapping and asymmetric routing delays.
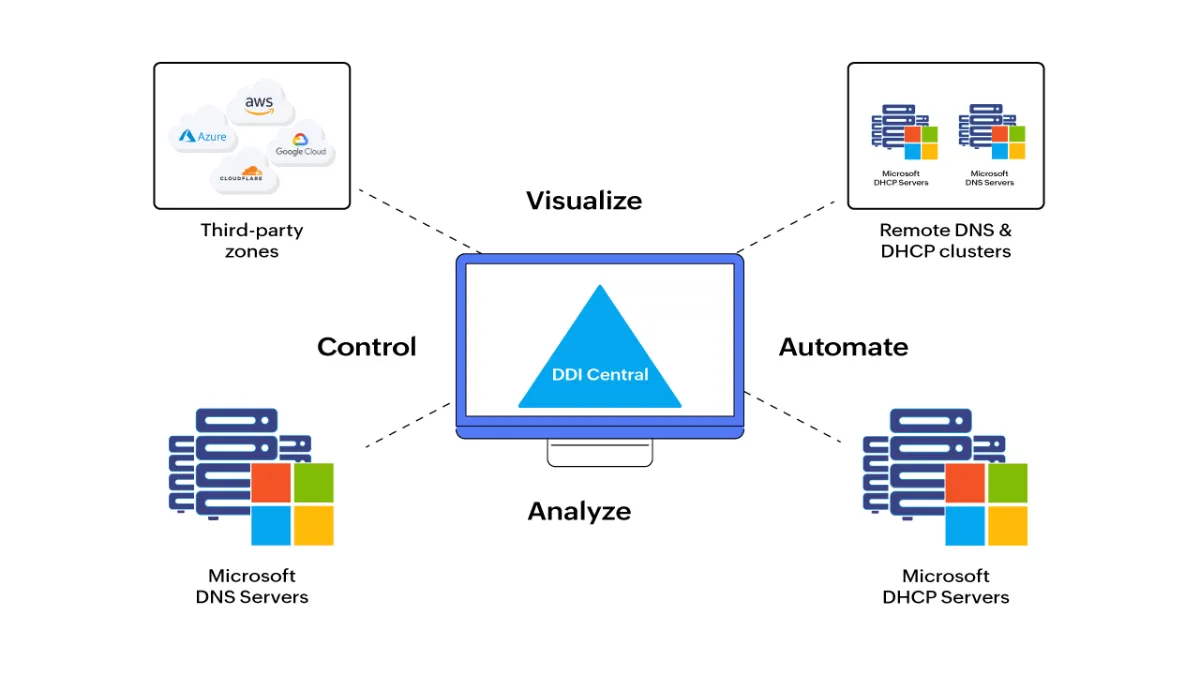
9. IP Address Management (DHCP, DNS, and IPAM)
IP Address Management (IPAM) coordinates Dynamic Host Configuration Protocol (DHCP) allocation and Domain Name System (DNS) resolution into a unified management layer. Effective IPAM prevents address exhaustion, eliminates IP conflicts, and correlates hostnames with dynamic lease histories.
- API Integration: Bi-directional RESTful sync APIs connecting DHCP/DNS appliances with automated cloud provisioning systems.
- Deployment Types: Centralized enterprise software suites, cloud-managed DDI services, or integrated domain controller roles.
- ML & Analytics: Machine learning models predict subnet pool depletion rates based on dynamic device connection history.
10. Flow Monitoring and Traffic Analysis
Flow monitoring ingests flow telemetry (NetFlow, IPFIX, sFlow) exported by routing devices to provide deep visibility into application layer traffic patterns. It categorizes network conversations by source/destination IPs, ports, and protocol types to optimize capacity planning and detect anomalous bandwidth spikes.
- Telemetry Protocols: Ingests stateful flow records including NetFlow v9, IPFIX, sFlow, and cloud VPC flow logs.
- Deployment Types: High-throughput distributed flow collector appliances and cloud-scale analytical data lakes.
- ML & Analytics: Leverages unsupervised ML clustering algorithms for User and Entity Behavior Analytics (UEBA) and DDoS detection.
Frequently Asked Questions
What is the main difference between active and passive network monitoring?
Active network monitoring injects synthetic traffic (such as ICMP ping sweeps or HTTP synthetic transactions) into the network to measure latency, availability, and response times. Passive network monitoring non-intrusively captures and analyzes existing network traffic (via SNMP polling, TAP/SPAN ports, or NetFlow exports) without generating additional network overhead.
Why is SNMPv3 preferred over SNMPv1 and SNMPv2c in enterprise environments?
SNMPv1 and SNMPv2c rely on plain-text community strings transmitted unencrypted across the wire, creating severe security vulnerabilities. SNMPv3 introduces robust security mechanisms, including user-based authentication (HMAC-MD5/SHA) and payload encryption (CBC-DES/AES), preventing unauthorized metric tampering and credential interception.
How does IPAM integrate with DHCP and DNS to maintain network health?
IP Address Management (IPAM) serves as a centralized source of truth that synchronizes dynamic IP allocations from DHCP servers with hostname records in DNS. This automated coordination prevents IP conflicts, ensures accurate reverse DNS resolution, and tracks lease audit trails for security compliance.
Advertisement