Deep Architectural Review of Obkio Network Performance Monitoring Software
Advertisement
Deep Architectural Review of Obkio Network Performance Monitoring Software
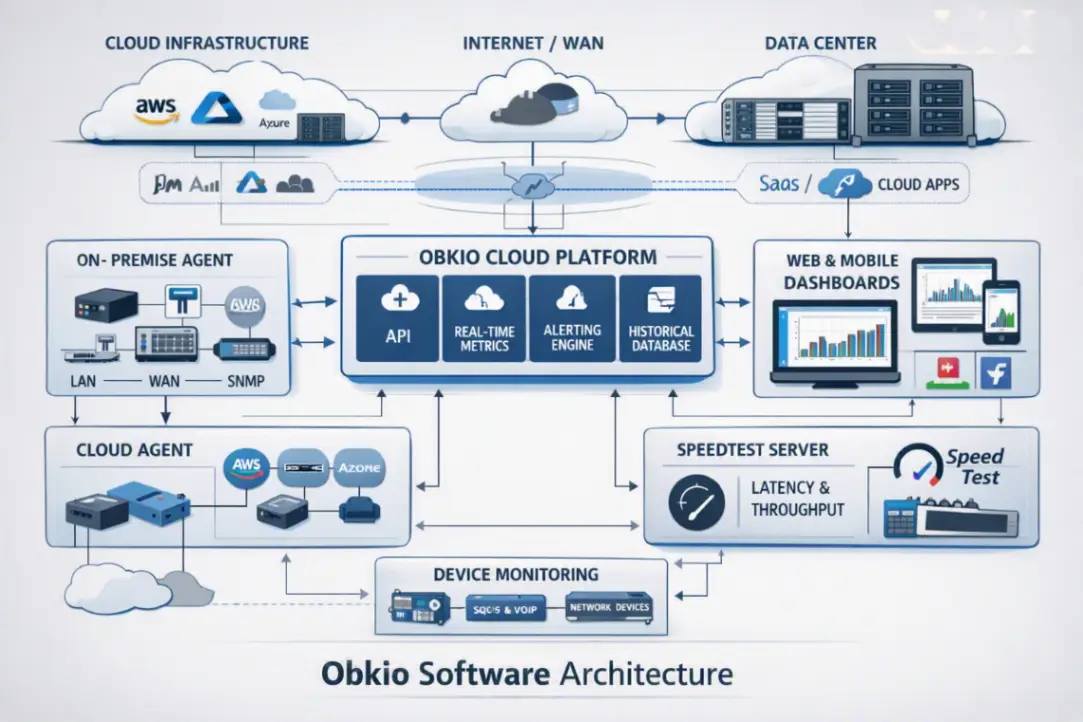
Maintaining high availability across modern enterprise networks requires real-time telemetry processing and proactive network performance monitoring across hybrid environments. As outlined in network telemetry standards established by the Institute of Electrical and Electronics Engineers (IEEE), utilizing continuous synthetic monitoring pairs prevents packet degradation from impacting production workloads. Below is a detailed technical review of 6 core architectural modules within the Obkio platform evaluated for enterprise telemetry, deployment ease, and root-cause diagnostic performance.
1. Continuous Synthetic Traffic Engine
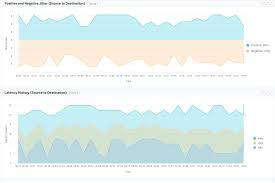
Obkio's core telemetry engine relies on continuous synthetic traffic generation between pairs of distributed monitoring agents to measure network performance without requiring passive packet mirroring. The engine exchanges lightweight UDP packets every 500ms to calculate precise latency, jitter, packet reordering, and bi-directional packet loss profiles.
- Sub-Second Sampling Rates: Transmits synthetic probes at 500ms intervals to capture sub-second intermittent degradation events missed by standard 5-minute polling tools.
- Dual-Ended Measurement Protocol: Measures inbound and outbound network metrics separately to identify asymmetrical routing and path degradation.
- Deployment Options: Operates natively across public cloud instances (AWS, Azure, GCP), hardware appliances, Docker containers, and software endpoints (Windows, macOS, Linux).
2. Multi-Type Monitoring Agent Architecture
Obkio utilizes a decentralized agent matrix designed to measure end-to-end performance across multi-cloud environments, branch offices, remote worker endpoints, and data centers. Agents communicate continuously with centralized cloud servers to push aggregated metrics and receive configuration updates over secure TLS channels.
- Public Cloud Monitoring Agents: Managed public agents hosted directly in major cloud tier provider datacenters (AWS, Azure, Google Cloud) to isolate ISP performance issues.
- Hardware & Virtual Appliances: Plug-and-play Linux-based mini hardware appliances and VMware/Hyper-V virtual appliances for automated site onboarding.
- Agent-to-Agent Mesh Topology: Establishes point-to-point synthetic testing tunnels between targeted location pairs without routing telemetry through central bottlenecks.
3. Network Device SNMP Polling Module
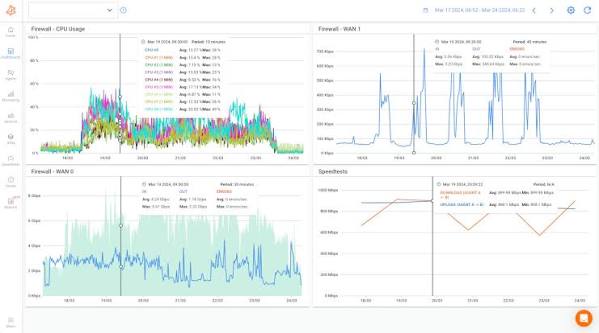
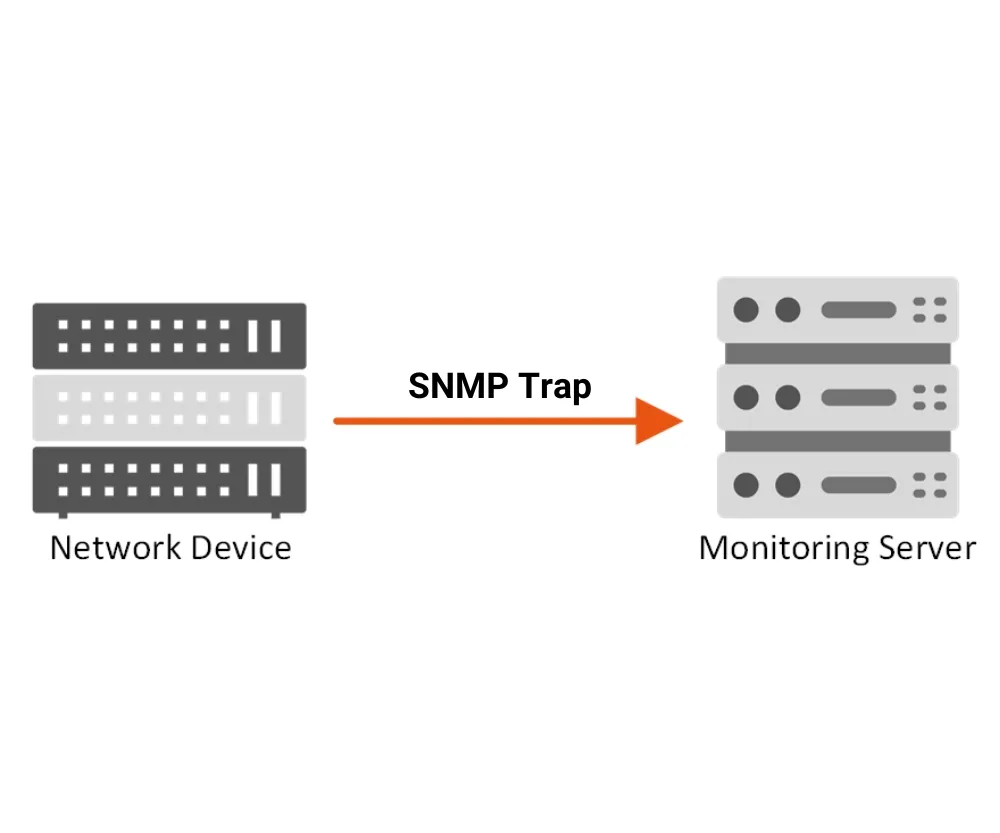
Obkio complements synthetic monitoring with agent-based SNMP polling (v1, v2c, v3) to track local physical network device resource utilization. The module queries switches, routers, firewalls, and access points to correlate external latency spikes with internal hardware resource constraints.
- Resource Telemetry Ingestion: Continuously polls CPU usage, memory utilization, bandwidth consumption, interface errors, and packet drop counts.
- Automated Device Discovery: Scans target subnet ranges to identify active network hardware and auto-assign pre-configured SNMP metric templates.
- Granular Interface Polling: Configurable polling cycles (down to 30 seconds) designed to detect micro-burst congestion on core switch trunks.
4. Visual Traceroute & Path Analysis
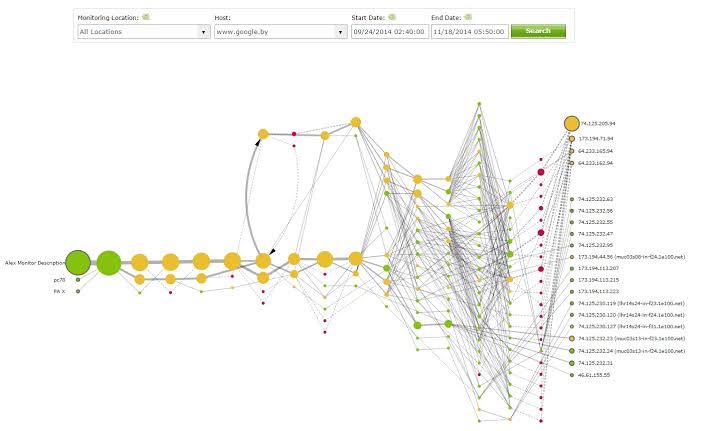
When synthetic monitoring detects performance anomalies, Obkio automatically executes stateful visual traceroutes to pinpoint the exact hop where packet loss or latency degradation occurs. This isolates issues between local LAN, provider SD-WAN tunnels, intermediate ISP backbones, or cloud gateway endpoints.
- Historical Path Hop Mapping: Retains hop-by-hop latency and loss data over time to detect route flaps and BGP path shifts retrospectively.
- Quality of Experience (QoE) Scoring: Converts complex packet loss, jitter, and round-trip time (RTT) data into standardized MOS (Mean Opinion Score) ratings every minute.
- Multi-Protocol Diagnostics: Supports ICMP, UDP, and TCP traceroute probes to bypass firewalls and isolate port-specific routing failures.
5. Application Performance & VoIP Monitoring
Obkio provides targeted application performance monitoring designed to emulate real-time business application traffic such as VoIP, video conferencing (Microsoft Teams, Zoom), and cloud SaaS applications. It actively evaluates connection stability to prevent dropped calls and buffering issues.
- VoIP Quality Analytics: Measures key VoIP metrics including Jitter Buffer Delay, Packet Reordering, and MOS scores to diagnose Session Initiation Protocol (SIP) issues.
- HTTP/S Destination Monitoring: Executes synthetic HTTP requests to monitor web application response times, DNS resolution latency, and SSL handshake times.
- Integration & Alerting APIs: Generates real-time alerts via Webhooks, Slack, PagerDuty, Microsoft Teams, and REST APIs for IT service management (ITSM) integration.
6. Speed Test & Bandwidth Assessment Engine
Obkio incorporates an automated on-demand and scheduled speed test module to verify total available network throughput and WAN capacity limits across remote branch sites. This allows IT teams to audit ISP service level agreements (SLAs) without deploying dedicated speed test servers.
- Scheduled Throughput Auditing: Automatically triggers TCP multi-stream speed tests during low-impact windows to quantify maximum WAN download/upload capacity.
- ISP SLA Verification: Logs historical speed test records alongside continuous latency baselines to substantiate carrier outage credit claims.
- Centralized Cloud Control: Managed remotely via the web dashboard without requiring manual intervention at individual agent sites.
Frequently Asked Questions
How does synthetic traffic monitoring differ from passive packet analysis?
Synthetic monitoring continuously generates synthetic probe packets across network paths to proactively measure latency, jitter, and packet loss every sub-second, identifying issues before users notice them. Passive packet analysis captures and inspects live production network traffic, which requires mirror ports or inline taps and only collects data when active users are transmitting data.
What system resources are required to deploy an Obkio Monitoring Agent?
Obkio Software Agents are lightweight and consume minimal CPU and RAM resources (typically requiring less than 100MB RAM and negligible CPU usage). They can be installed on existing Windows, macOS, or Linux machines, Docker containers, or deployed as turnkey hardware/virtual appliances without impacting host performance.
Can Obkio monitor network paths through third-party cloud and SaaS environments?
Yes. By deploying a local Monitoring Agent within your network paired with Obkio's managed Public Agents in AWS, Azure, Google Cloud, or target SaaS endpoints, Obkio continuously measures the performance of external network paths, enabling complete visibility into ISP and cloud provider performance.
Advertisement