Architectural Analysis: The 8 Best SmokePing Alternatives for Enterprise Latency & Jitter Tracking
Advertisement
Architectural Analysis: The 8 Best SmokePing Alternatives for Enterprise Latency & Jitter Tracking
While Tobi Oetiker's open-source SmokePing remains a foundational benchmark for measuring network latency and packet loss using multi-probe ICMP bursts, modern hybrid cloud architectures require significantly higher telemetry cardinality, agentless scalability, and automated root-cause isolation. According to specifications from the IEEE, low-latency transmission standardizations in distributed systems demand real-time statistical sampling that moves beyond static Round Robin Database (RRD) file configurations. Enterprise monitoring suites now integrate active synthetic testing with real-time route path telemetry and machine-learning-driven alerting thresholds.
1. Site24x7 Network Monitoring
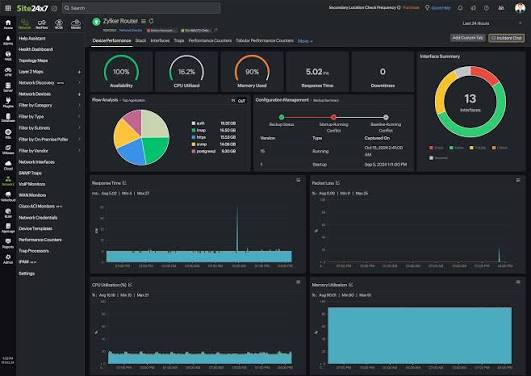
Site24x7 delivers a cloud-native, SaaS-based synthetic network monitoring framework that replaces static RRD file polling with dynamic, distributed cloud probes. The platform executes continuous ICMP, TCP port, and DNS lookup probes to measure hop-by-hop latency and packet loss across hybrid infrastructure environments.
- Probing & Telemetry APIs: RESTful APIs for programmatic probe deployment, metric ingest, and real-time integration with IT Service Management (ITSM) pipelines.
- Anomaly Engine: Machine learning algorithms that calculate adaptive baselines for round-trip times (RTT) to reduce false-positive latency alerts.
- Deployment Model: Hybrid architecture combining SaaS-hosted global vantage points with lightweight on-premises Polling Agents.
2. Paessler PRTG Network Monitor
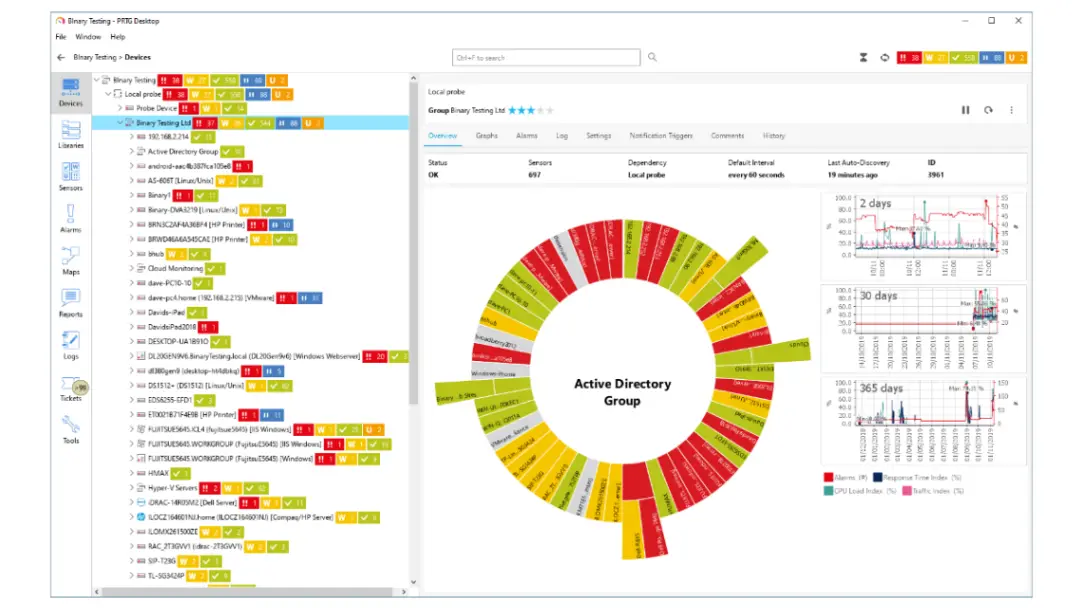
Paessler PRTG Network Monitor provides a highly granular sensor-based architecture capable of capturing round-trip latency, packet loss, and jitter using dedicated Ping, QoS, and Cisco IP SLA sensors. Its unified engine eliminates file-based RRD bottlenecking by writing high-frequency probe data directly to a proprietary, high-performance time-series database.
- Probing & Telemetry APIs: HTTP REST API and native PowerShell/Python custom sensor interfaces for programmatic data extraction and probe automation.
- Anomaly Engine: Threshold-based statistical monitoring combined with automated historic trend detection across sensor channels.
- Deployment Model: Self-hosted Windows Server deployment or managed cloud instance via PRTG Hosted Monitor.
3. PingPlotter
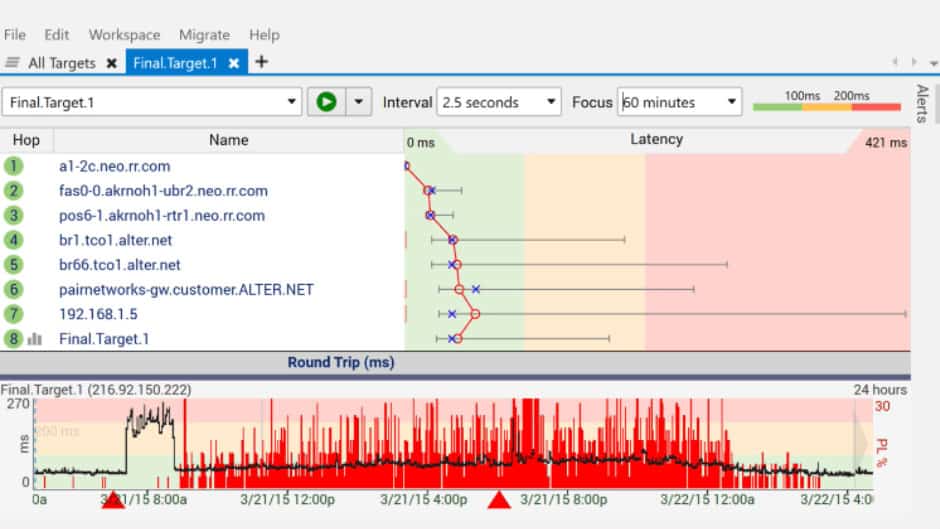
PingPlotter provides real-time graphical hop-by-hop path tracing by continuously transmitting ICMP, UDP, or TCP packets along the entire network path to a destination. The software explicitly isolates network congestion, packet drop points, and jitter spikes across intermediate routers, providing immediate visibility into localized service provider degradation.
- Probing & Telemetry APIs: Scriptable ping engine with summary web API export capabilities for embedding latency charts into external dashboards.
- Anomaly Engine: Automated route-change tracking and rule-based diagnostic alerts triggered by sustained latency variance or target packet loss thresholds.
- Deployment Model: Native cross-platform desktop application (Windows, macOS, iOS) alongside cloud-managed PingPlotter Cloud agents.
4. MTR (My Traceroute)
MTR combines the operational capabilities of the standard traceroute and ping utilities into a single, high-frequency command-line diagnostic tool. It continuously polls intermediate network hops using ICMP ECHO or UDP datagrams to render real-time statistical distributions of packet loss, latency averages, and host responsiveness.
- Probing & Telemetry APIs: Command-line parameter flags supporting raw JSON, XML, and CSV programmatic output for ingestion into modern observability pipelines.
- Anomaly Engine: Non-predictive; relies on real-time raw statistical counters (Min, Max, Mean, Standard Deviation, Loss%).
- Deployment Model: Lightweight, open-source Linux/Unix CLI utility (also available for macOS and Windows environments).
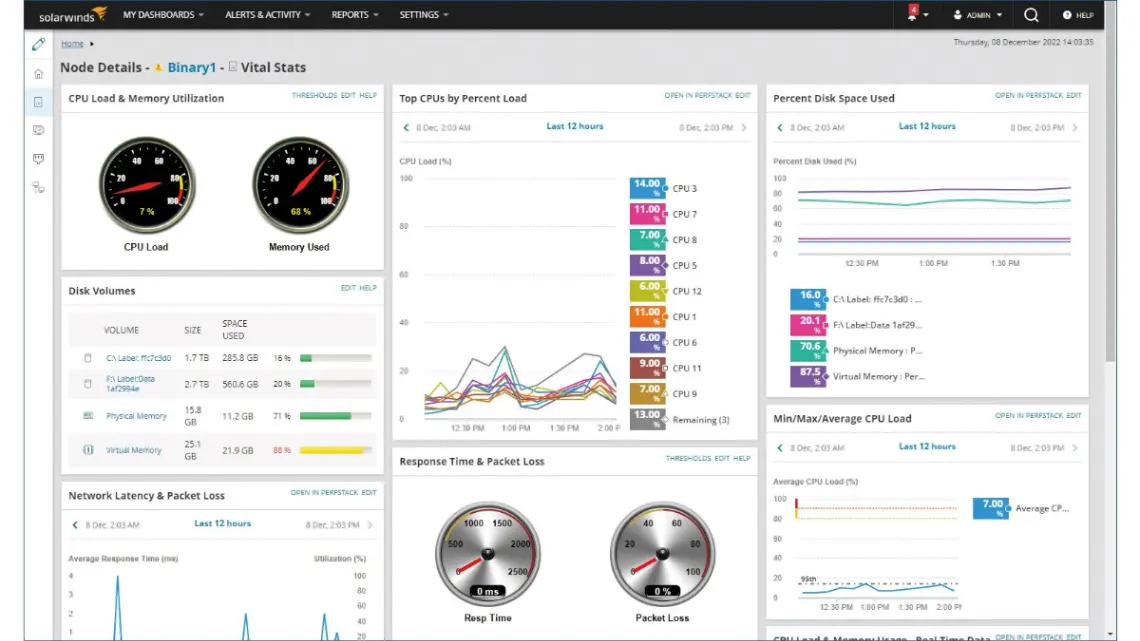
5. SolarWinds Network Performance Monitor (NPM)
SolarWinds NPM provides enterprise-grade latency and path visualization through its proprietary NetPath feature, which actively probes single and multi-path network trajectories. It correlates ICMP latency metrics with SNMP state data and flow records to deliver complete path visibility across complex enterprise WANs and cloud services.
- Probing & Telemetry APIs: SolarWinds Information Service (SWIS) REST API supporting SWQL queries for automated node provisioning and metric collection.
- Anomaly Engine: Intelligent baseline calculation engine utilizing historic statistical distributions to dynamically calculate threshold alerts.
- Deployment Model: On-premises Windows Server deployment with support for distributed polling engines across enterprise locations.
6. Nagios XI
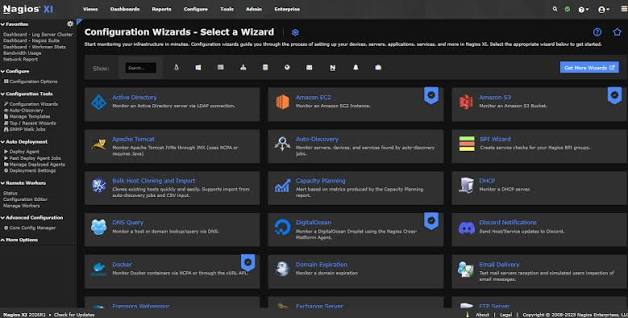
Nagios XI builds upon the robust, open-source Nagios Core engine to offer scalable active monitoring of host availability, ICMP response metrics, and network service latency. Its plugin-driven architecture allows network architects to run custom check scripts alongside standard check_icmp and check_ping execution plugins.
- Probing & Telemetry APIs: Enterprise REST API facilitating full configuration management, status retrieval, and external dashboard integration.
- Anomaly Engine: Rule-based notification management featuring configurable warning/critical state thresholds and flapping detection logic.
- Deployment Model: On-premises Linux deployment (RHEL/CentOS) or pre-configured Virtual Appliance (VMware, Hyper-V).
7. Cacti
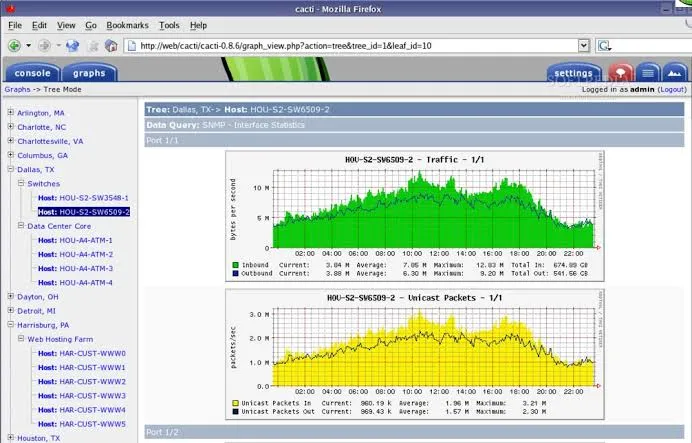
Cacti is an open-source network monitoring and graphing framework designed around an RRDtool data storage architecture similar to SmokePing. Utilizing an optimized SNMP polling engine (Spine), Cacti collects interface metrics and active ping data to render high-density, customizable performance graphs.
- Probing & Telemetry APIs: Command-line automation scripts and community-driven REST plugins for automated device registration and graph creation.
- Anomaly Engine: Threshold-based alerting plugin architecture (Thold) evaluating current poller values against static or baseline limits.
- Deployment Model: Open-source Linux/Unix platform executing on a standard LAMP/LEMP web stack.
8. MultiPing
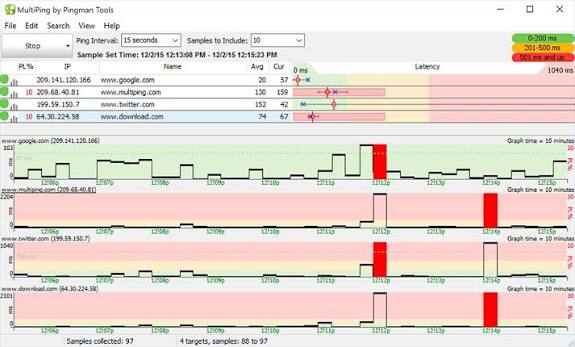
MultiPing engineered by PingPlotter delivers low-overhead, high-frequency ICMP target monitoring across hundreds of destination IP addresses simultaneously. It offers an intuitive visual matrix displaying real-time latency trends, packet loss percentages, and historical response curves for rapid network troubleshooting.
- Probing & Telemetry APIs: Native workspace exporter with command-line launch parameters for scheduled ping session automation.
- Anomaly Engine: Real-time visual pattern matching accompanied by threshold-based acoustic and email alerts.
- Deployment Model: Lightweight desktop installer optimized for modern Microsoft Windows workstations and Windows Server operating systems.
Frequently Asked Questions
What are the primary performance limitations of SmokePing in modern enterprise environments?
SmokePing relies on static RRD files that pre-allocate storage and use fixed-step data downsampling, which limits high-cardinality telemetry analysis. Additionally, managing large-scale, multi-tenant probe deployment configurations using traditional Perl scripts creates operational overhead compared to modern API-driven SaaS monitoring tools.
How does active ICMP probing differ from passive network flow monitoring?
Active ICMP probing regularly injects synthetic packets into the network path to measure exact end-to-end round-trip latency, jitter, and packet loss regardless of active user traffic. Passive flow monitoring (e.g., NetFlow, IPFIX) analyzes existing host packet headers to compute volume and application throughput, but cannot measure off-peak latency or precise hop-by-hop degradations without live traffic flow.
Which SmokePing alternatives support open-source deployment without proprietary licensing costs?
MTR, Nagios Core, and Cacti provide fully open-source alternatives to SmokePing. MTR offers instant command-line path tracing and jitter analysis, while Cacti provides an open-source RRDtool-based graphing web interface with extensive SNMP and ping polling customizability.
Advertisement