Architectural Guide to Diagnosing and Mitigating Packet Loss in Windows Environments
Advertisement
Architectural Guide to Diagnosing and Mitigating Packet Loss in Windows Environments
Modern enterprise IP communications depend on reliable transmission control protocols and deterministic routing paths across hybrid infrastructure. Network layer diagnostics require strict adherence to standard protocol specifications such as IETF RFC 792 ICMP to accurately quantify packet drop rates, round-trip times (RTT), and jitter across distributed topologies.
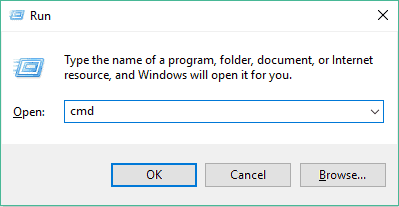
1. Windows Command Prompt CLI Discovery
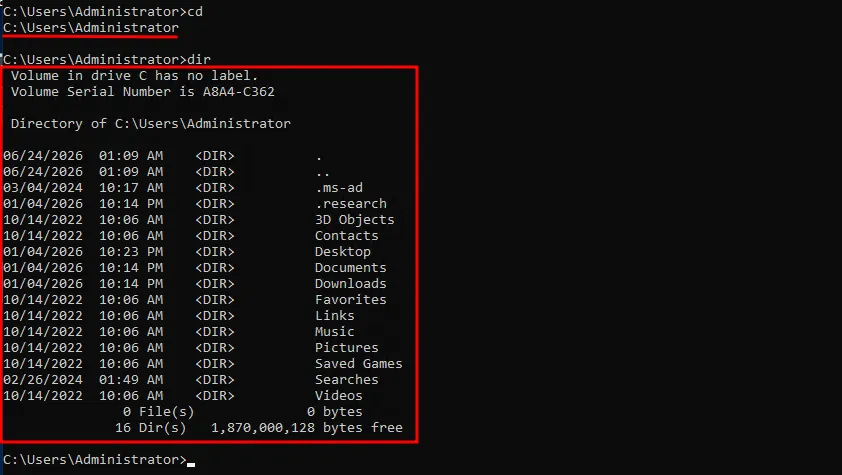
The native Windows Command Prompt (cmd.exe) provides the primary execution runtime for executing low-level TCP/IP diagnostics and socket-level network queries. Utilizing standard utility binaries allows administrators to audit interface configurations, IP routing tables, and active socket bindings without third-party overhead.
- Socket Execution Model: Native execution of win32 console subsystem calls for direct system socket binding.
- Interface Auditing: Fast identification of active IPv4/IPv6 bindings, subnet masks, and default gateway routes via
ipconfig /all. - Deployment Type: Zero-dependency, lightweight command-line environment built into all Windows kernel deployments.
2. Local Gateway ICMP Diagnostics (RF & Physical Layer)
Targeting the local default gateway with explicit ICMP echo requests isolates packet degradation occurring on the immediate local area network (LAN) or wireless physical layer. High packet drop rates during gateway testing indicate local RF signal attenuation, channel interference, or failing local network interface controllers (NICs).
- ICMP Payload Crafting: Configurable sequence testing using targeted packet counts (e.g.,
ping [Gateway_IP] -n 25) to generate statistically valid sample sizes. - Metrics Extracted: Direct calculation of percentage loss alongside minimum, maximum, and mean Round-Trip Time (RTT) in milliseconds.
- Signal Layer Isolation: Differentiates Wi-Fi radio frequency (RF) degradation from upstream ISP WAN infrastructure congestion.
3. External Endpoint WAN Diagnostics (Network Congestion)
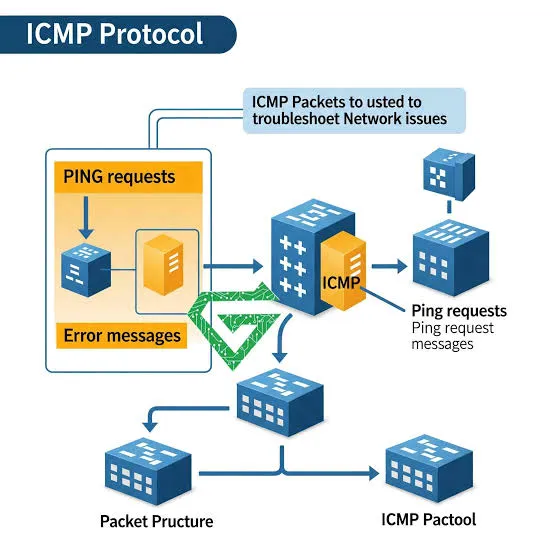
Executing ping requests to geographically distant public endpoints (such as reliable public DNS or cloud servers) evaluates multi-hop routing paths across wide area networks. Comparing zero loss on local gateway tests against drop rates on external targetsPinpoints transit congestion across intermediate autonomous systems (AS).
- Multi-Hop Path Analysis: Evaluates packet survival across multiple intermediate router hops and peering points.
- Congestion Quantification: Identifies network queue overflows and buffer drop events across ISP transit layers.
- API & Protocol Integration: Standard IPv4/IPv6 ICMP Echo Request and Echo Reply messaging sequences.
4. TCP/IP Sequence & Acknowledgement (ACK) Protocol Engine
The underlying TCP/IP protocol stack manages connection statefulness by tracking segment sequence numbers and receiver acknowledgements (ACKs). When unacknowledged segments time out, TCP triggers dynamic sliding window size adjustments and selective retransmissions to prevent network collapse.
- Reliability Mechanisms: Automatic segment retransmission upon expiration of Retransmission Timeout (RTO) timers.
- Flow Control Dynamics: Adaptive adjustment of TCP congestion window (cwnd) size based on detected segment drops.
- Protocol Telemetry: Precise metric extraction via OS TCP kernel counters and packet capture analyzers.
5. Infrastructure Congestion & Buffer Queue Exhaustion
When transit throughput exceeds hardware queue limits on intermediate routers and switches, packet drops occur due to tail drop or active queue management policies. This congestion-induced loss introduces latency spikes and packet reordering, degrading real-time protocol delivery.
- Bufferbloat Vulnerability: Over-buffered network hardware increasing latency without preventing ultimate packet drops.
- Traffic Shaping Controls: QoS (Quality of Service) and DSCP tagging implementations to prioritize mission-critical payloads.
- Deployment Impact: Degrades enterprise VoIP (SIP/RTP), video conferencing, and low-latency transactional DB syncs.
6. Physical Network Hardware & NIC Degradation
Physical layer flaws—including damaged Ethernet cabling, failing switch ports, or thermal throttling on network interfaces—introduce corrupt frames that are silently discarded at the Data Link layer (Layer 2). These hardware-level failures result in sustained packet loss regardless of network traffic load.
- Cyclic Redundancy Check (CRC) Errors: Damaged frames dropped at the MAC layer prior to OS IP stack processing.
- Hardware Diagnostics: Interface counter tracking for drop counts, collisions, and frame alignment errors.
- Maintenance Overhead: Requires physical layer replacement, NIC driver updates, or port re-negotiation.
7. Ingress Security Threats & Malicious Traffic Drops
Security anomalies such as Distributed Denial of Service (DDoS) SYN floods or malicious packet drop attacks flood network hardware capacity, forcing firewalls and edge routers to drop legitimate packets. Security appliances intentionally drop traffic when security inspection rules or connection tables saturate.
- Attack Mitigation Impact: Rate-limiting and blackhole routing policies unintentionally dropping valid client traffic.
- Threat Vectors: Volumetric UDP/ICMP floods, SYN floods, and state-exhaustion fire wall attacks.
- Detection Telemetry: Integration with SIEM engines and automated edge scrubbing center APIs.
8. Automated Enterprise Synthetic Monitoring Integration
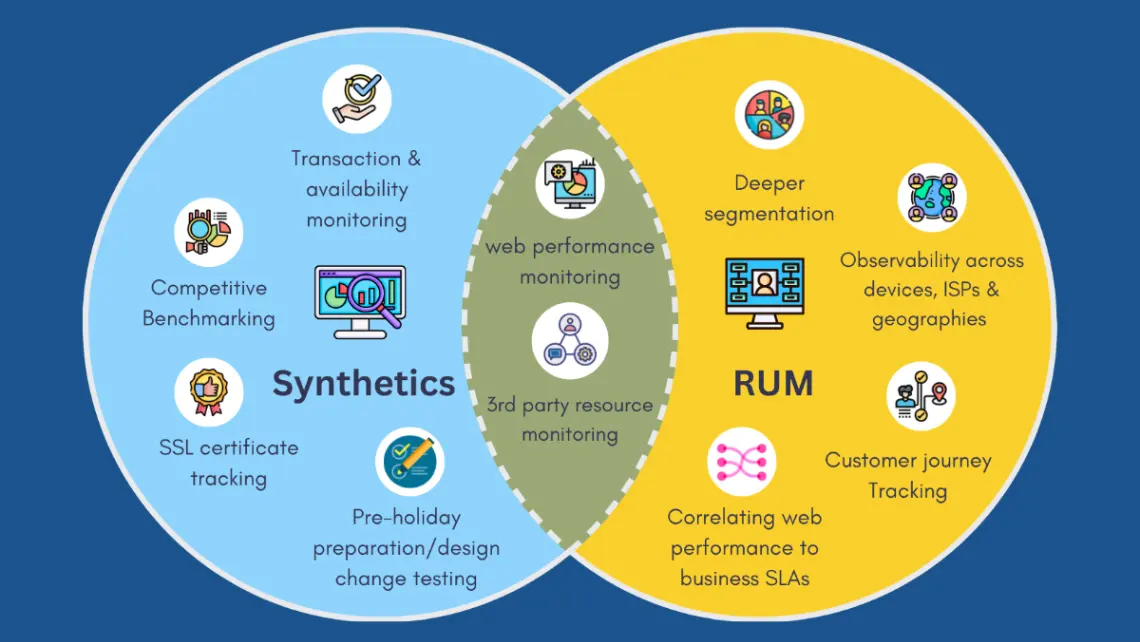
While CLI utilities provide point-in-time diagnostics, continuous enterprise observability requires automated synthetic network monitoring systems. Enterprise solutions like Site24x7 Network Monitoring deliver proactive continuous path probing, real-time alert triggers, and root-cause analysis dashboards for complex distributed networks.
- Continuous Telemetry: Automated, round-the-clock ICMP, TCP, and UDP synthetic polling across hybrid networks.
- ML-Driven Anomaly Detection: Machine learning baselining to automatically detect latent jitter and abnormal packet loss trends.
- SaaS Integration: Multi-tenant SaaS platform featuring webhook APIs, automated alerting, and enterprise SLA reporting.
Frequently Asked Questions
What is an acceptable percentage of packet loss for enterprise applications?
For general web browsing, a packet loss rate below 1% is tolerable. However, for real-time applications like enterprise VoIP, video conferencing, and financial trading platforms, packet loss must remain strictly under 0.05% to prevent severe degradation.
How does packet loss differ from network latency and jitter?
Latency measures the time taken for data to travel from source to destination, while jitter measures the variability in latency over time. Packet loss occurs when data packets fail to reach their destination entirely, forcing protocol retransmissions.
Why does testing packet loss on Wi-Fi yield higher drop rates than wired Ethernet?
Wi-Fi relies on unguided radio frequency transmission susceptible to physical obstacles, distance attenuation, and co-channel interference from adjacent wireless networks, whereas Ethernet provides isolated, shielded physical medium connectivity.
Advertisement