Architectural Guide to Critical Website Performance Indicators & Observability Metrics
Advertisement
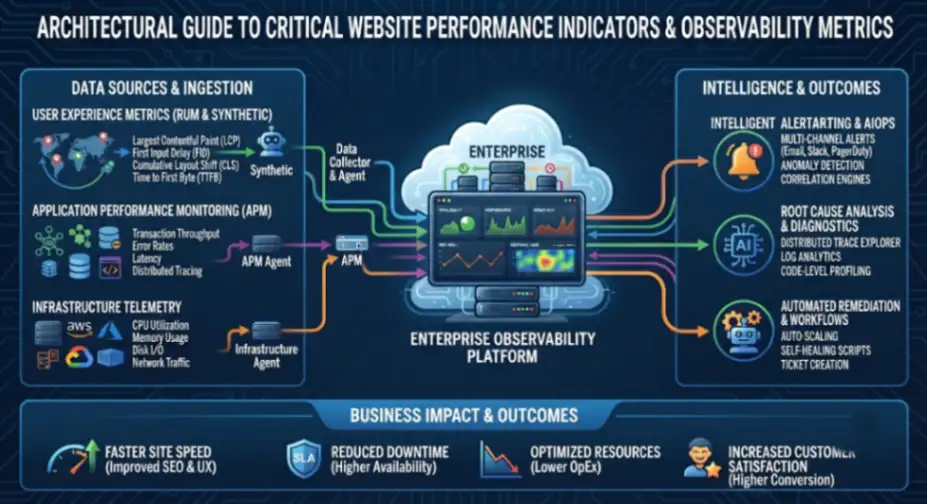
Architectural Guide to Critical Website Performance Indicators & Observability Metrics
Evaluating end-to-end web application performance requires synthesizing metrics from both Real User Monitoring (RUM) and synthetic probe agents. Standards established by the W3C Web Performance Working Group specify navigation timing primitives that form the backbone of modern enterprise telemetry. Telemetry ingestion platforms like Site24x7 unify client-side paint metrics, backend socket connections, and edge cache performance into automated AIOps alerting pipelines.
1. Page Load Time
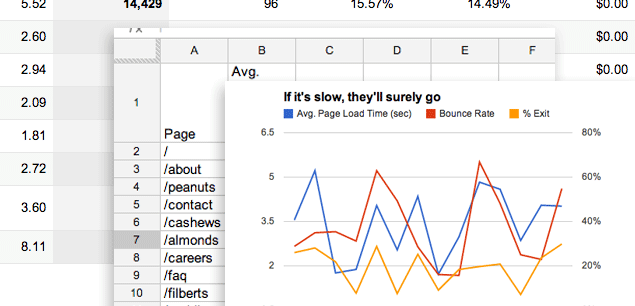
Page Load Time measures the complete elapsed interval from the initial HTTP GET request initiation to the browser DOM onload event execution. It provides a baseline metric for overall page delivery efficiency across static assets, dynamic API calls, and third-party scripts.
- API Integration: Captures data via standard W3C
PerformanceNavigationTimingwindow interfaces. - Telemetry Mechanism: Aggregates both Synthetic probe measurements and client-side RUM beacon transmissions.
- Deployment Context: Multi-region SaaS edge monitoring and CDN performance auditing.
2. Time to First Byte (TTFB)
TTFB quantifies the exact duration between the client sending a network request and receiving the first byte of response data from the server. It evaluates backend application routing overhead, web server thread pool efficiency, and network routing latency.
- Metrics Pipeline: Measures DNS lookup, TCP handshake, TLS negotiation, and server process delay.
- Optimization Target: Identifies unindexed database queries and un-cached reverse proxy routes.
- Deployment Type: Serverless gateway tracing and cloud infrastructure benchmarking.
3. DNS Resolution Time
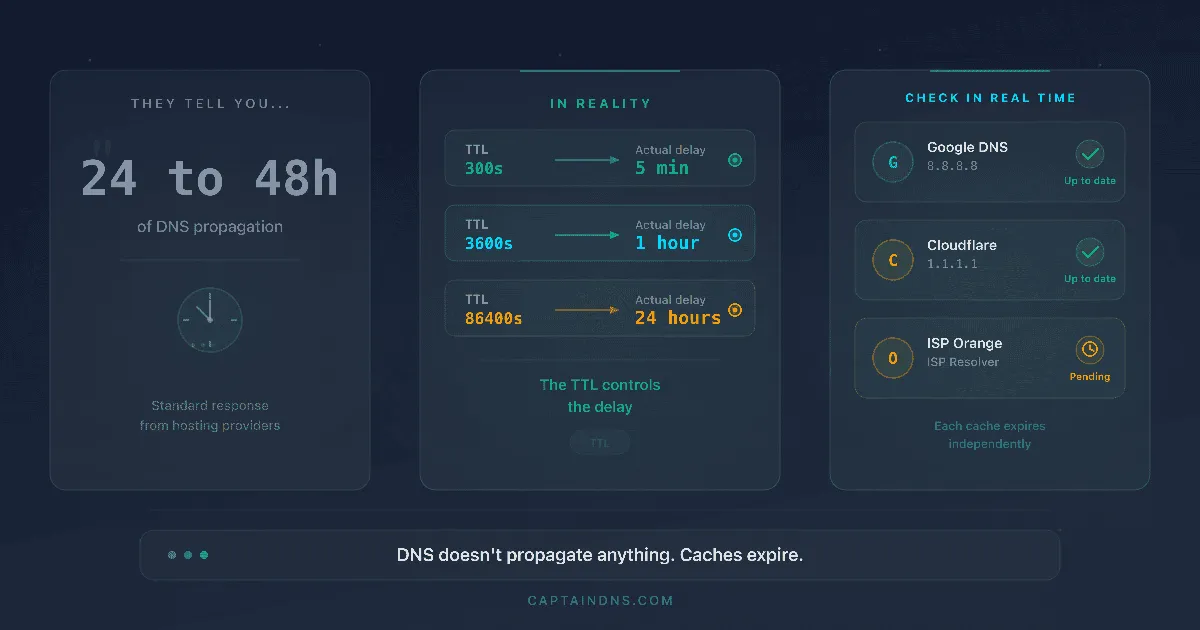
DNS Resolution Time measures the delay incurred while resolving a human-readable domain name into an IP address via authoritative DNS nameservers. High resolution times directly delay TCP socket creation, stalling all subsequent asset fetching pipelines.
- Protocol Telemetry: Evaluates UDP/53 and DNS-over-HTTPS (DoH) recursive lookups.
- ML Anomaly Detection: Detects DNS route poisoning, TTL misconfigurations, and root server latency spikes.
- Deployment Type: Distributed global Synthetic agent probing across multi-cloud PoPs.
4. First Contentful Paint (FCP)
FCP measures the time from navigation to when the browser renders the first piece of DOM content, such as text, SVG, or non-white canvas elements. It marks the initial perceptual feedback point for real-world user interactions.
- Browser Engine Hooks: Directly hooks into Chromium Blink and WebKit rendering pipeline events.
- Optimization Signal: Isolates render-blocking CSS, critical JavaScript bundles, and web font loading bottlenecks.
- Deployment Type: Real User Monitoring (RUM) JavaScript agent injection.
5. Largest Contentful Paint (LCP)
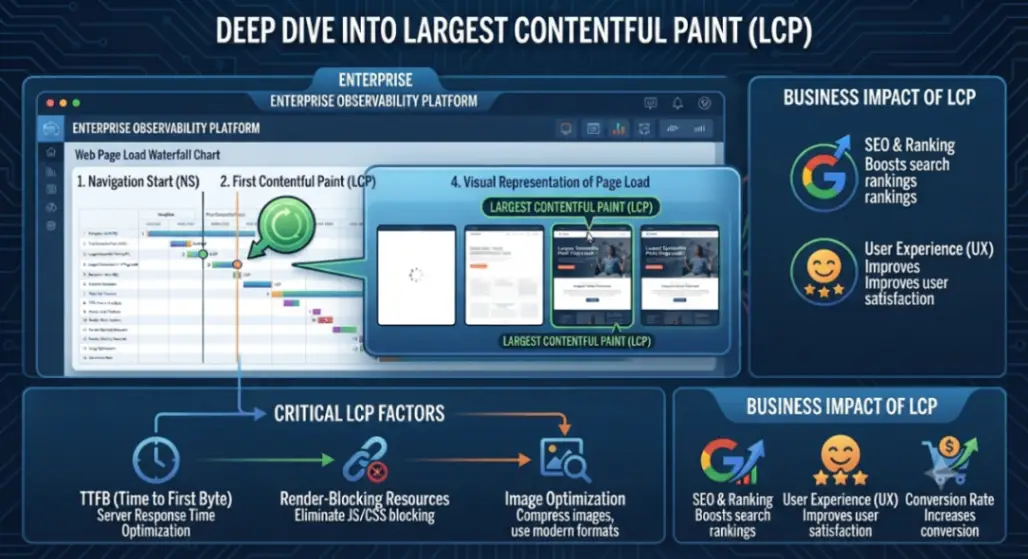
LCP tracks the render time of the largest image block or text container visible within the user viewport relative to page initiation. As a core Google Web Vital, it reflects perceived main-content load performance.
- Viewport Telemetry: Monitors dynamic DOM elements until user input freezes performance recording.
- Core Differentiator: Replaces deprecated synthetic load metrics with actual user viewport rendering states.
- Deployment Type: Continuous SEO monitoring and frontend UX performance telemetry.
6. Cumulative Layout Shift (CLS)
CLS measures visual stability by calculating the sum total of all unexpected layout shift scores occurring across the entire page lifecycle. It quantifies sub-optimal layout reflows caused by asynchronous asset loading or dynamic DOM injections.
- Algorithmic Score: Multiplies impact fraction by distance fraction for frame shifts.
- Front-End Diagnostics: Highlights un-dimensioned
<img>elements and dynamically injected ad IFrames. - Deployment Type: Automated CI/CD pipeline performance regression testing.
7. Interaction to Next Paint (INP)
INP evaluates overall page responsiveness by measuring the latency of all user interactions (clicks, taps, keypresses) with the document during its lifespan. It replaces First Input Delay (FID) to provide a comprehensive interaction assessment.
- Event Telemetry: Tracks event input delay, processing time, and presentation delay parameters.
- Performance Boundary: Identifies long-running JavaScript main-thread tasks obstructing browser paint cycles.
- Deployment Type: RUM telemetry engines running on high-concurrency client web applications.
8. HTTP Error Rates
HTTP Error Rates calculate the percentage of total web requests resulting in 4xx client errors or 5xx server failures relative to successful 2xx responses. High error rates signal application runtime crashes, broken API routes, or proxy timeouts.
- Log Processing: Parses real-time web server logs (Nginx, Apache, IIS) and ingress API gateways.
- Alerting Workflows: Triggers automated incident tickets and PagerDuty webhooks when error ratios cross SLO boundaries.
- Deployment Type: Agent-based log analytics and reverse proxy telemetry monitoring.
9. Connection Time
Connection Time measures the duration required to establish the network transport layer connection, including TCP 3-way handshake and TLS/SSL cryptographic negotiation. It isolates network routing inefficiency from backend server code latency.
- Network Layer Probing: Analyzes SYN-ACK handshake times and TLS v1.3 cipher suite negotiation delays.
- Edge Optimization: Evaluates CDN edge termination, HTTP/3 QUIC adoption, and keep-alive socket reuse.
- Deployment Type: Network Synthetics and distributed eBPF host agent monitoring.
Frequently Asked Questions
What is the difference between Synthetic Monitoring and Real User Monitoring (RUM) for website performance indicators?
Synthetic Monitoring utilizes automated headless browser scripts deployed at global Points of Presence (PoPs) to simulate user actions in a controlled environment, ideal for baseline benchmarking and pre-deployment testing. Real User Monitoring (RUM) injects lightweight client-side JavaScript agents to record live telemetry, browser paint events, and network latency experienced by real users in real-world network conditions.
How do Core Web Vitals directly impact technical SEO and business conversions?
Core Web Vitals (LCP, CLS, INP) serve as direct search engine ranking signals under Google's page experience framework. Poor metrics lead to search visibility degradation, while high visual instability (CLS) or latency (INP) directly increases bounce rates, dropping overall e-commerce conversion rates.
Why should Time to First Byte (TTFB) be monitored independently from total Page Load Time?
TTFB specifically isolates backend infrastructure efficiency—such as web server processing, database execution time, and reverse proxy routing—from client-side rendering bottlenecks. Total Page Load Time incorporates network bandwidth, third-party script tags, and DOM construction delays, making TTFB essential for isolating server-side performance degradation.
Advertisement